
- Dogecoin has bounced off its ascending trendline near $0.23–$0.24, which shows that bulls are defending this important medium-term support level in a bullish manner.
- RSI has bounced off horizontal support, which is consistent with price action seeing a momentum reset, increasing the odds of continued bullish continuation.
- The weekly chart shows that Dogecoin is staying above the 50 EMA at $0.21, and although the MACD shows that momentum appears to be weakening, it still has a bullish bias.
Dogecoin (DOGE) has been resilient after recovering through trendline and RSI support, which has indicated additional buying power amid current market pressures.
Price Holding Above Trendline Support
Dogecoin has been respecting an ascending trendline since June, with each test attracting renewed buying momentum. Recently, DOGE rebounded near the $0.23–$0.24 zone, confirming the trendline’s validity. This level has now become a critical reference point for traders.
Trader Tardigrade acknowledged that the bounce showed commitment by aggressive bulls defending this support. The confluence of technical strength at this stage strengthens the case for continuation. Holding this structure keeps the wider uptrend officially in play in the medium term.
In case the momentum is maintained, the price might reach the resistance at 0.30-0.32. Breaking out of this important zone would provide space for a greater upward extension. However, failure to hold trendline support could shift focus toward $0.20, which remains a strong psychological level.
RSI and Momentum Rebound
Alongside price structure, momentum indicators also support the bullish case. The Relative Strength Index recently rebounded from horizontal support, an area where DOGE has often regained strength. This technical reaction shows alignment between price support and momentum reset.
The RSI recovery suggests that the selling pressure has eased. Historically, such rebounds have provided the base for renewed upward attempts, particularly when aligned with price-holding key zones. This dual confirmation increases the probability of continued buying interest.
Market observers point to the large upward arrow on the chart shared by Trader Tardigrade, signaling a possible extension higher. If RSI maintains stability above its base, buyers may retain control over the near-term trajectory.
EMA and MACD Signals
On the weekly timeframe, DOGE trades near $0.23 after a sharp 12% pullback. Despite the correction, price action remains above the 50-period exponential moving average (EMA) at $0.21. This moving average continues to provide structural support to the ongoing uptrend.
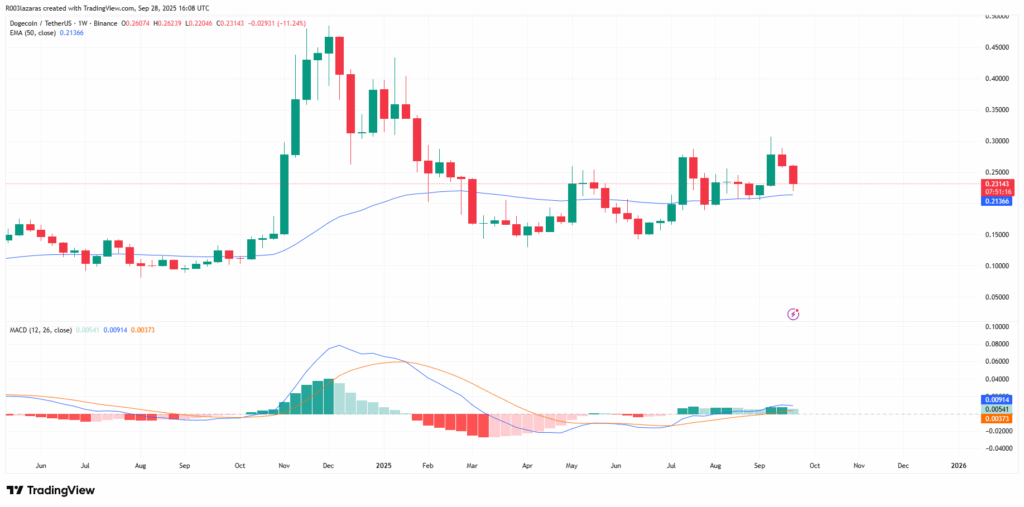
A breakdown below the 50 EMA would shift market focus toward a possible bearish turn. For now, holding above this indicator maintains a positive technical bias. Traders closely watch this level for either renewed rebounds or weakness.
The MACD indicator is showing a loss of momentum. The MACD line is still above the signal line but the histogram is losing green bars. The indication here is that buying momentum is slowing, and a cautious look for trend changes should be made. It will be important to remain above the 50 EMA to keep bullish momentum in the short term.