
- Doge/BTC charts display recurring rounded bottoms and mid-cycle lower highs, signaling historical patterns that often precede sharp upward price movements.
- Analysts note current compression on long-term support, suggesting volatility is low and momentum may shift toward a strong Dogecoin rally.
- Fractal patterns indicate potential Dogecoin targets at $2 and $5, echoing prior historic cycles observed in 2017 and 2021.
Dogecoin’s performance against Bitcoin is drawing attention as historical price patterns suggest a potential spike may be approaching. Analysts observe consistent cycles of accumulation followed by sharp upward movements. These recurring structures provide insight into possible near-term trends.
Historical Patterns in Doge/BTC Trading
The Doge/BTC daily chart shows long periods of sideways accumulation followed by sudden upward bursts. Historical cycles display rounded bottoms, where selling pressure diminishes and price consolidates. These formations have repeatedly preceded notable Dogecoin rallies against Bitcoin.
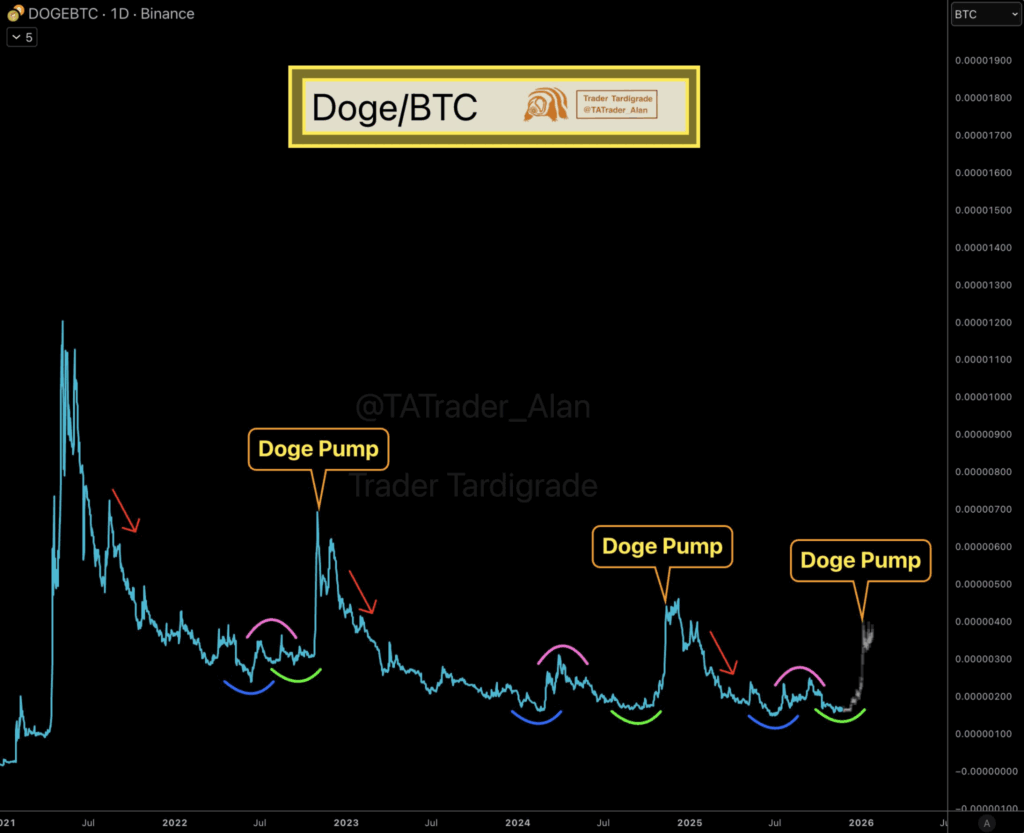
Pink arcs on the chart mark mid-cycle lower highs, which often appear before Doge begins upward momentum. Traders use these points as visual indicators of the transition from accumulation to upward movement. Red arrows highlight moments where prior pumps exhausted, returning the price to a mean level before repeating.
Current patterns on the chart resemble earlier formations closely. Doge/BTC is positioned on long-term support, and volatility is currently compressed. Analysts note a familiar upward curve forming, which may signal the onset of the next price surge.
Technical Signals Suggesting Upward Movement
Crypto market observers highlight that Dogecoin exhibits boom-and-bust cycles against Bitcoin. Extended periods of low activity are often followed by sudden vertical price moves. The repeating structure on Doge/BTC points to a potential breakout phase.
Trader Tardigrade tweeted that the present chart setup mirrors previous cycles, suggesting a spike may be imminent. According to the analysis, the combination of low volatility and accumulated support indicates that Doge may begin an upward trajectory soon.
The repeated compression pattern indicates that Dogecoin has historically moved sharply following these setups. Analysts consider these visual markers useful for identifying momentum shifts and potential entry points for traders.
Fractal Patterns Indicate Possible Rally Targets
Crypto Patel highlighted that Dogecoin’s monthly chart shows patterns similar to prior historic runs in 2017 and 2021. The fractal structure combined with macro breakout signals indicates potential for a strong rally.
According to Patel, previous spikes suggest a range of possible gains, projecting clean upward movements from tenfold to thirty-threefold based on repeating chart structures. Analysts note that these fractal-based targets align with historical Dogecoin cycles.
The projected targets include a near-term goal of $2 and a longer-term target of $5. These levels are derived from repeating price patterns, supporting technical analysis without speculative exaggeration.