- Dogecoin price has charted a descending channel, and analysts are closely watching support at $0.21-$0.22 for a rebound.
- Transactions over $1 million on Whale have increased before major price movements, suggesting possible accumulation or profit-taking by large investors.
- The Stochastic RSI and Bollinger Bands suggest an oversold condition, with resistance at $0.29 and a possible breakout to $0.50.
Dogecoin (DOGE) has seen a period of steady activity, with daily active addresses, transactions, and whale movements holding at key levels. While the price has experienced fluctuations, analysts suggest a potential breakout if trading volume and whale participation increase.
Price Movements and Market Trends
Ali, a well-known cryptocurrency analyst, stated that Dogecoin activity has remained steady, with daily active addresses, transactions, and whale movements maintaining key levels. He suggested that a surge in these metrics could indicate the beginning of an upward movement.
Dogecoin’s price initially surged, reaching a peak in mid-January, particularly around the 18th. However, after this high, the cryptocurrency entered a downward trend with intermittent recoveries. Market analysts observe a descending channel pattern, with the price nearing the lower boundary, suggesting a possible rebound in the near term.
Whale transactions exceeding $1 million have shown periodic increases before major price movements, indicating accumulation or profit-taking by large investors. Active addresses have also fluctuated in response to price changes, demonstrating retail traders’ sensitivity to market conditions.

Technical Indicators and Key Levels
The Bollinger Bands indicate that Dogecoin’s price is near the lower band, suggesting an oversold condition that may lead to an upward correction. The middle band represents a key resistance level, while the upper band signals potential breakout territory. Additionally, the Stochastic RSI remains low, reinforcing the possibility of a price reversal
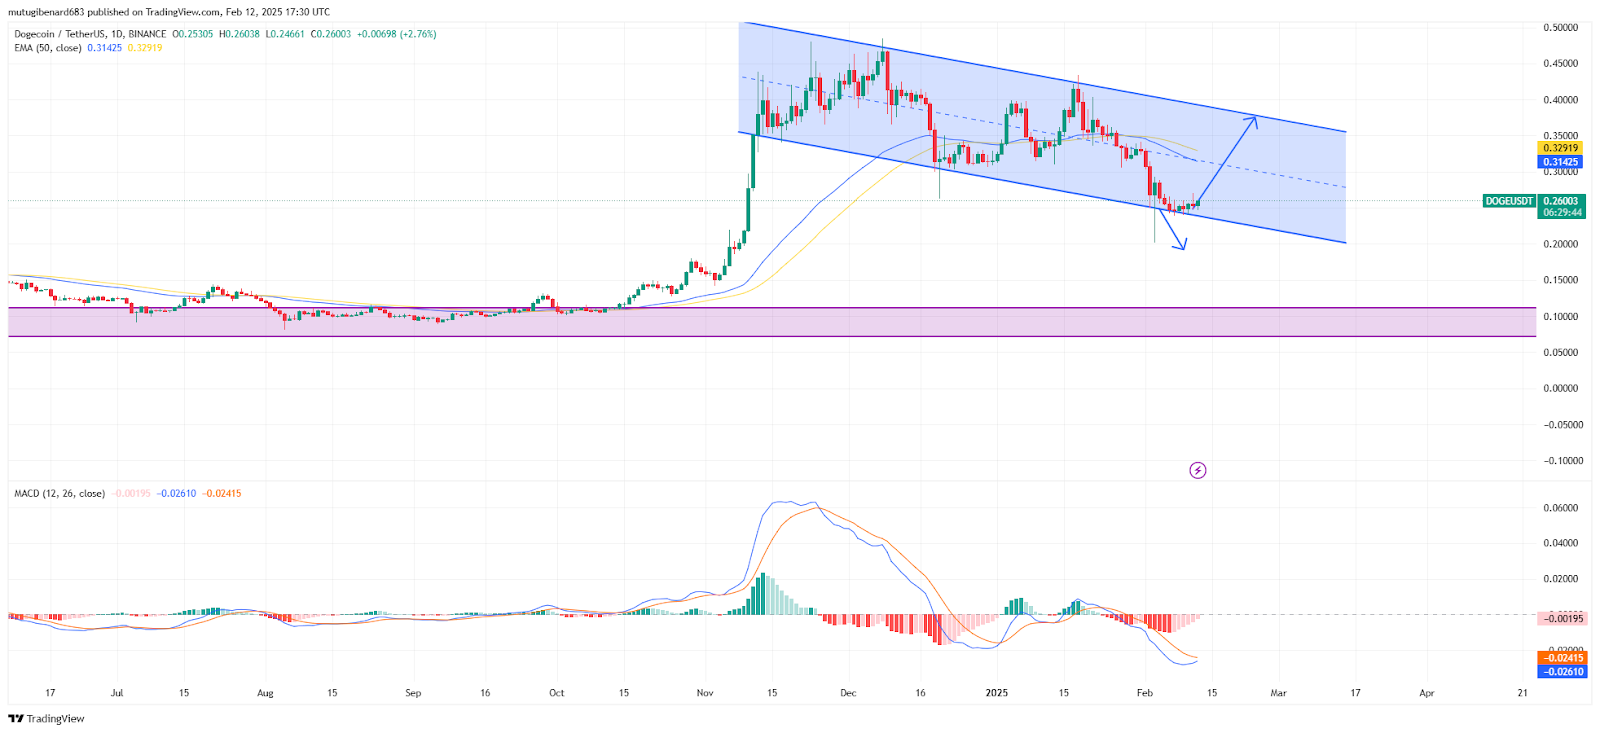
Support for DOGE is observed around the $0.21-$0.22 range, aligning with the lower Bollinger Band and the base of the descending channel. On the upside, resistance is positioned at $0.29, with further resistance near $0.36-$0.37. A breakout above these levels could push Dogecoin toward the $0.50 range.
Potential Scenarios and Market Outlook
According to the bullish estimate, Dogecoin will rise from support points toward $0.29 before potentially reaching $0.36-$0.37. Any move below the $0.21 level on the Dogecoin price chart could push the cryptocurrency down toward $0.15 or beyond. Market participants watch the mid-line resistance of Bollinger Bands in addition to stochastic RSI behavior because these signals can confirm the upcoming market direction.
The total trading volume for Dogecoin during the past day amounted to $1.38 billion. During writing, Dogecoin traded at $0.252, yet its value showed a decrease of 5.27% from the beginning of the period and 4.54% over the preceding week.