
- Crypto capital inflows declined from $135B in December to $3B in March, signaling reduced liquidity and a shift in investor sentiment.
- Market trends indicate declining net positions, with inflows shrinking and stablecoin holdings increasing as investors seek safer assets.
- The drop in inflows suggests caution, with funds moving into stable assets rather than fueling new market rallies.
The cryptocurrency space has witnessed a dramatic turn in investor activity and capital flows. Numbers show a drop to December’s all-time peaks, with a closer look taken at market dynamics.
Capital Flow Reduction
Analyst Ali_charts has tweeted that cryptocurrency capital flows fell to $3 billion today from $135 billion last December. This is reflective of a major dip in liquidity levels and investor activity.
The capital inflows peaked to $134.87 billion in December. They declined to $3.12 billion by March 19, 2025. The figures reveal a stark decline in new capital entering the market.
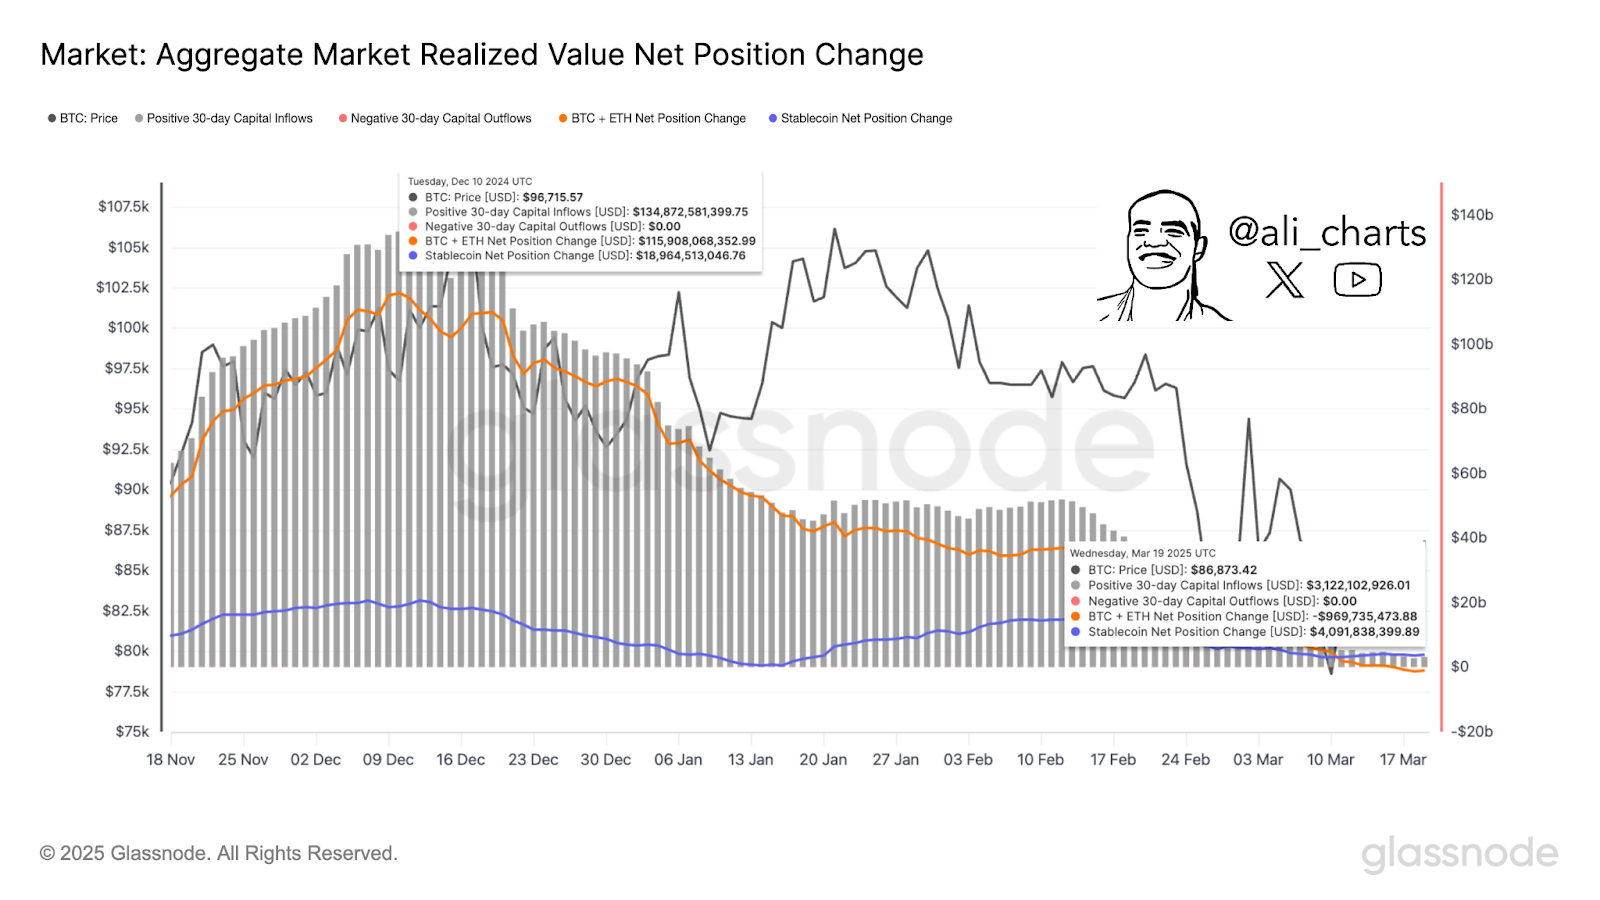
There were no significant capital outflows during this period. Movement is motivated by a decrease in positive capital inflows and not by increased withdrawals.
Evolution of Bitcoin Price
From November to December of 2024, Bitcoin’s worth exceeded $100,000. It reached a peak near $96,715.57 on December 10. It was a time of strong market action and bullish prices.
After peaking in December, Bitcoin’s value declined steadily. From late January onwards, there was a rise in volatility. By March 19, 2025, it dipped to $86,873.42, a significant decline compared to before.
The pattern of prices is reflected closely by that of capital flows and indicates a relation between valuation and liquidity in the market. Specialists observe that reduced capital flows are in line with lowering prices.
Investor Sentiment and Stablecoin Growth
The net position change for Bitcoin and Ethereum decreased from $115.91 billion in December to -$969.73 million in March. From this data, we can see that exposure to these assets was reduced by investors during these months. Stablecoin net positions grew to $4.09 billion in March from $18.96 billion in December. This is a reflection that funds were moved by investors to less risky assets during periods of market uncertainty.
The rise in stablecoin positions shows that there is still liquidity in the system despite lowering riskier positions. Market players are still monitoring these indicators for other changes in sentiment and market stability.
The information found in these charts offers a clear account of recent months’ market development. Trends in capital flow, prices, and investor positioning form a factual basis for understanding current market conditions.