- Cosmos (ATOM) validated a breakdown of a descending triangle at $3.57 and below, which indicated the continuation of a bearish momentum and high selling power on the market.
- Technical indicators indicate the consistent negative momentum, and Fibonacci levels suggest potential decreases to $2.66, $2.29 and an important support at 1.60.
- Analysts observe that a key retest zone of $3.40- $3.60 can tell whether Cosmos can reverse or keep its bearish trend.
Cosmos (ATOM) officially entered a bearish continuation following the loss of crucial support around $3.57. The breakdown beneath this descending triangle pattern has opened the way for a scenario of increasing selling pressure in which a movement toward $1.60 is targeted within weeks.
Descending Triangle Breakdown Confirms Bearish Continuation
Crypto analyst Ali _charts reported that Cosmos ($ATOM) has broken down from a large descending triangle, confirming a bearish continuation setup. The structure had been forming for months, with lower highs compressing against a flat base at $3.57. The decisive move below this zone now validates sellers’ dominance in the market.
Following the breakdown, ATOM is consolidating around $3.20, trading beneath the former support, which has now turned into resistance. Analysts suggest that a short-term recovery toward $3.40–$3.60 may occur as the market retests this broken base. However, unless the price reclaims that level with strong volume, it is expected to serve as a selling region before the next decline.
Technical projections using Fibonacci extensions point toward multiple downside checkpoints. These include $2.66 at the 1.272 Fib level, $2.29 at 1.414, and $1.83 at 1.618, with the final bearish target positioned between $1.53 and $1.60, where long-term buyers may begin to emerge.
Momentum Indicators Show Bearish Control Persists
Cosmos has continued in a prolonged downtrend, moving lower overall and establishing lower highs and lower lows since it lost support near $3.60. Price action is still weak as price could be consolidating before another leg down.
The RSI is at 34, which indicates that the price is under bearish pressure. While the reading is close to oversold territory, any pop higher would only be temporary in nature. Price could move upward sharply, but any high would only be a short-term corrective rally while the downtrend remains in place.
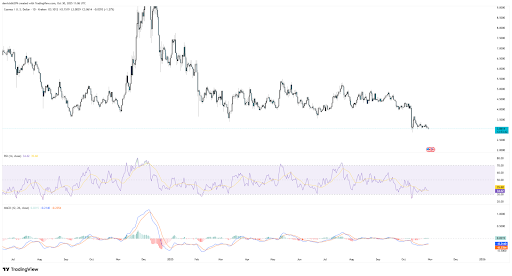
The histogram is still negative, and the MACD signal lines are also still below the zero axis at the same time. There’s no bullish crossover on the MACD either. This all means that there is weak buying pressure and that we have not seen any signs of a price reversal.
Key Levels to Watch as Sellers Maintain Pressure
The next key zone for buyers rests between $3.40 and $3.60. It would take a recovery back to this zone to challenge the broader bearish outlook. Without a recovery, $ATOM is still subject to further downside towards lower support zones.
If sellers continue to dominate, traders expect that the price could extend losses toward $2.80–$2.50 in the near term. These areas align with Fibonacci projections and historical demand zones that may temporarily slow the decline.
The bearish scenario would not be invalidated without a decisive daily close above $3.80–$4.00 in Cosmos. Until that takes place, the technical momentum and market structure suggest that $1.60 remains the primary target, reflecting cautious sentiment across the Cosmos market.