
- LINK dropped from $10.80 to $9.60, forming lower highs and lower lows amid sustained short-term selling pressure.
- Analyst Crypto Patel notes a bullish structure shift with upside liquidity targets at $10.86 and $11.85 if confirmed.
- RSI near 44 and improving MACD suggest early stabilization, though breakdown below $9.60 risks deeper move toward $9.30.
Chainlink (LINK) traded under mixed conditions between May 9 and May 17 as price declined from $10.80 toward $9.60. Analyst Crypto Patel stated LINK shifted into a bullish structure after CISD, highlighting a breaker block and liquidity zones targeting $10.86 and $11.85. However, market data showed continued bearish pressure despite short stabilization attempts near support levels.
Bullish Structure Shift After CISD Formation
According to Crypto Patel, LINK entered a bullish structure shift following CISD. The analyst identified a retracement into a breaker block aligned with prior displacement. Patel also pointed to a discount zone retracement and IFVG support below price action.
He added that liquidity is above current levels, forming upside targets. Targets include $10.86 and $11.85. However, invalidation remains a daily close below $8.90. Patel advised waiting for confirmation inside the breaker block before entering positions.
He described the setup as a controlled move toward buy-side liquidity. Meanwhile, TradingView noted a divergence between LINK structure and short-term price action, as selling pressure continues across recent sessions.
Price Action Confirms Short-Term Bearish Pressure
Between May 13 and May 16, LINK recorded repeated selloffs with increased trading volume. The sharpest move occurred on May 16, when LINK dropped from $10.10 to below $9.70.

Lower highs and lower lows dominated the structure across the period. This pattern confirmed weakening short-term momentum despite recovery attempts.
Price stabilized slightly above $9.60 afterward. This level now acts as immediate support in the current structure.
Indicators Show Early Recovery Signals
The RSI is near 44.65, with its moving average around 38.91. It remains below the neutral 50 level, keeping broader momentum bearish. However, RSI movement from oversold territory shows easing selling pressure.
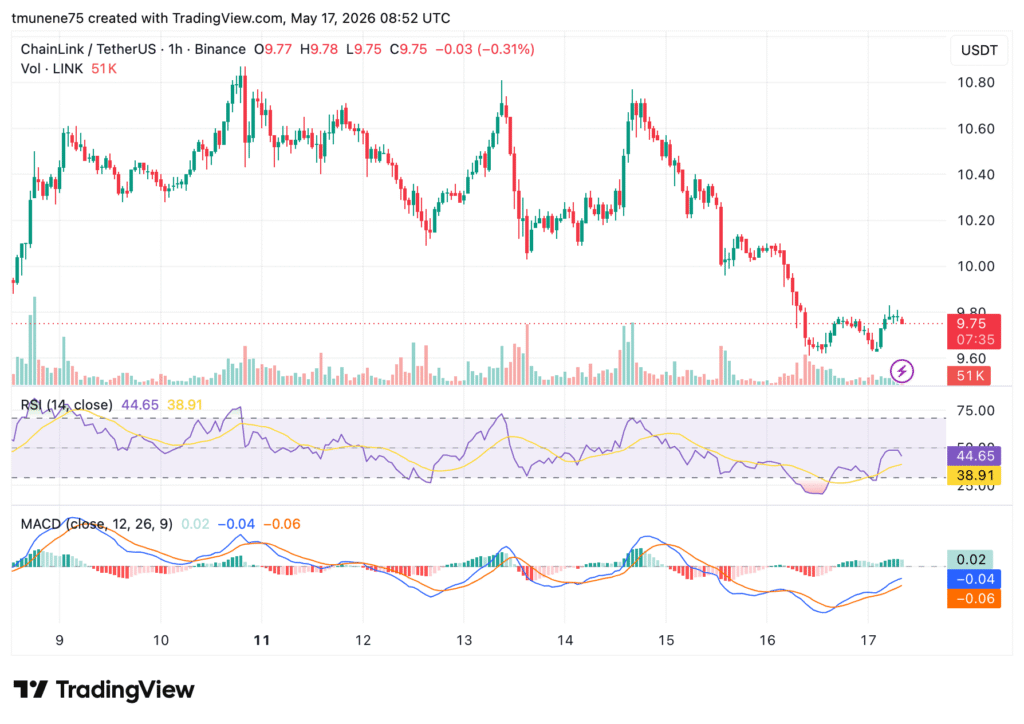
This shift suggests early stabilization conditions. MACD data shows improving momentum. The histogram turned slightly positive near 0.02, while a potential bullish crossover is forming.
Resistance levels remain at $9.90–$10.00 and $10.20. A breakout above these zones could extend movement toward $10.60. However, failure to hold $9.60 may expose LINK to a decline toward $9.30–$9.40.