
- The TD Sequential indicator flashes a buy signal, hinting at a potential trend reversal for Chainlink (LINK) after its recent downtrend.
- LINK is testing the 800 EMA near $14.34, a historically strong support, with resistance at $16.40 and $17.50 acting as breakout targets.
- The Stochastic RSI remains oversold, suggesting possible upward momentum if buyers step in, pushing LINK toward recovery in the short term.
Chainlink is trading in a possible reversal point after a lengthy downtrend. The TD Sequential on a daily time scale displayed a red “9” signal, which is a signal of possible exhaustion of selling. The traders are closely monitoring major support and resistance levels in anticipation of direction.
TD Sequential Indicator and Market Structure
Crypto analyst Ali_charts indicated TD Sequential flashed a buy signal on a daily time scale. The signal is typically the end of a downtrend, which can result in a bounce in price. The current pattern of a small-bodied doji is a signal of uncertainty in the market. LINK recently broke down below $15.00, but bounced back quickly, which is a sign of buying support on lower levels.
The current price is now testing a support of between $14.00 and $14.50. If this support is upheld, its subsequent resistance is in levels of $16.00 – $16.40. A breakout above this band can send LINK towards upper levels, while a breakdown can lead to downward movements.
Support, Resistance, and Trendline Analysis
LINK broke down below a declining trendline, confirming a bearish trend. The price is now testing the 800 Exponential Moving Average of around $14.34. This is a classically firm support point. If LINK is maintained above this EMA, it can potentially trend towards the $17.50 resistance.
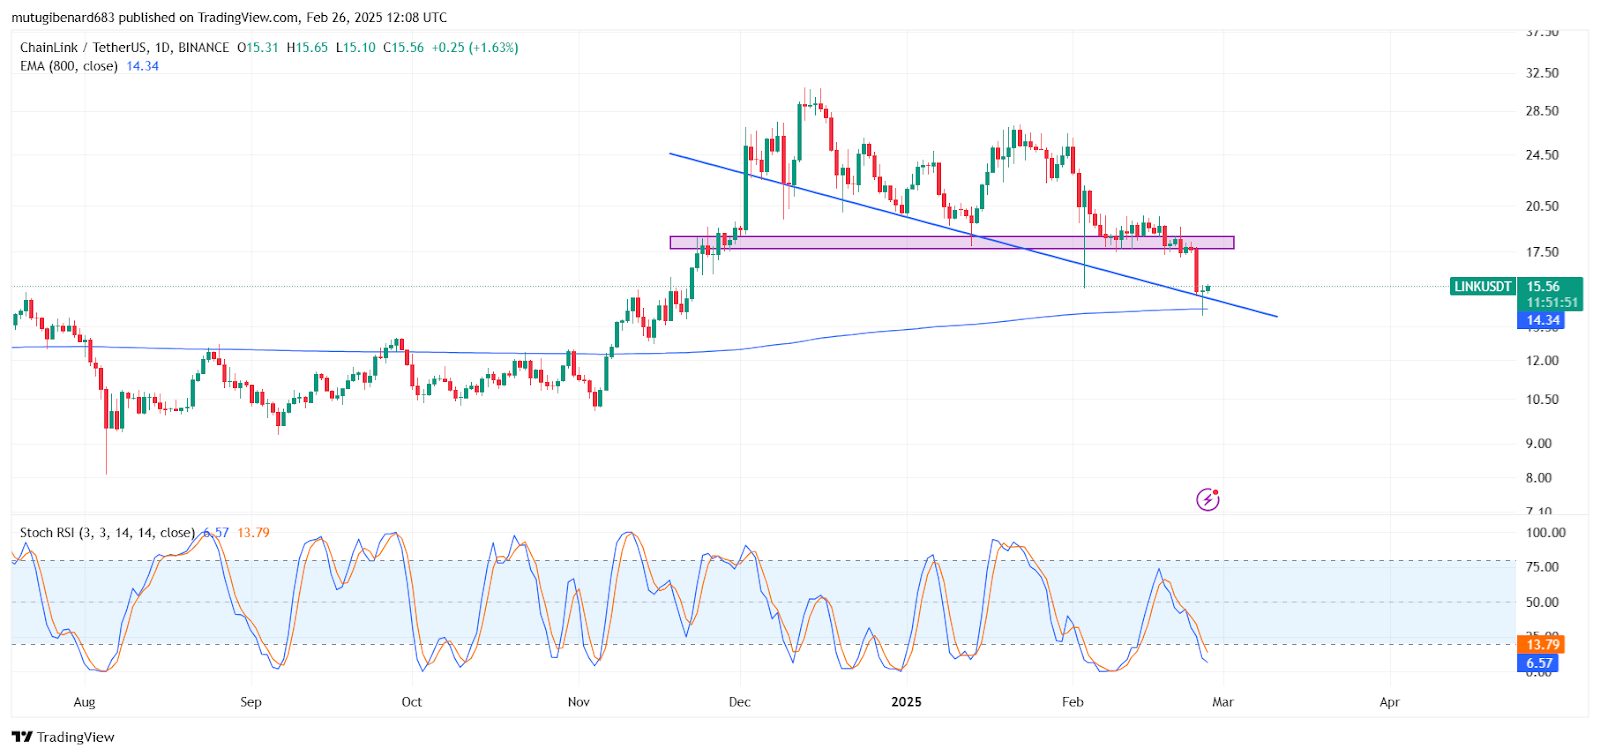
Resistance is due at $16.40, a point of historical breakdown. If LINK trades below $14.34, further downward movement towards $12.00 – $13.00 is possible. The market players are monitoring these levels for trading opportunities.
Momentum Indicators and Market Outlook
Stochastic RSI is currently in an oversold situation between 5.45 (blue) and 13.42 (orange). The occurrence of an upward crossover above 20 can be an indication of mounting buying pressure.
The market value of ChainLink (LINK), as of writing, stood at $15.49, a 5.55% increase in the last 24 hours but a 14.16% drop in seven days.