
- Chainlink’s price recovery shows a clear double-bottom formation, indicating structured technical behavior that may support a breakout toward higher resistance levels.
- Technical indicators such as MACD and DMI record strong market activity, with key support and resistance levels shaping the current trading dynamics.
- Increased trading volume and sustained higher lows emphasize Chainlink’s recovery phase, as technical analysis captures the asset’s evolving behavior in the market.
Chainlink has recorded a robust rebound in recent trading. Technical indicators reveal that the asset is testing strong resistance and support levels with heavy trading. Trading history indicates room for a decisive move soon.
Chart Pattern and Price Recovery
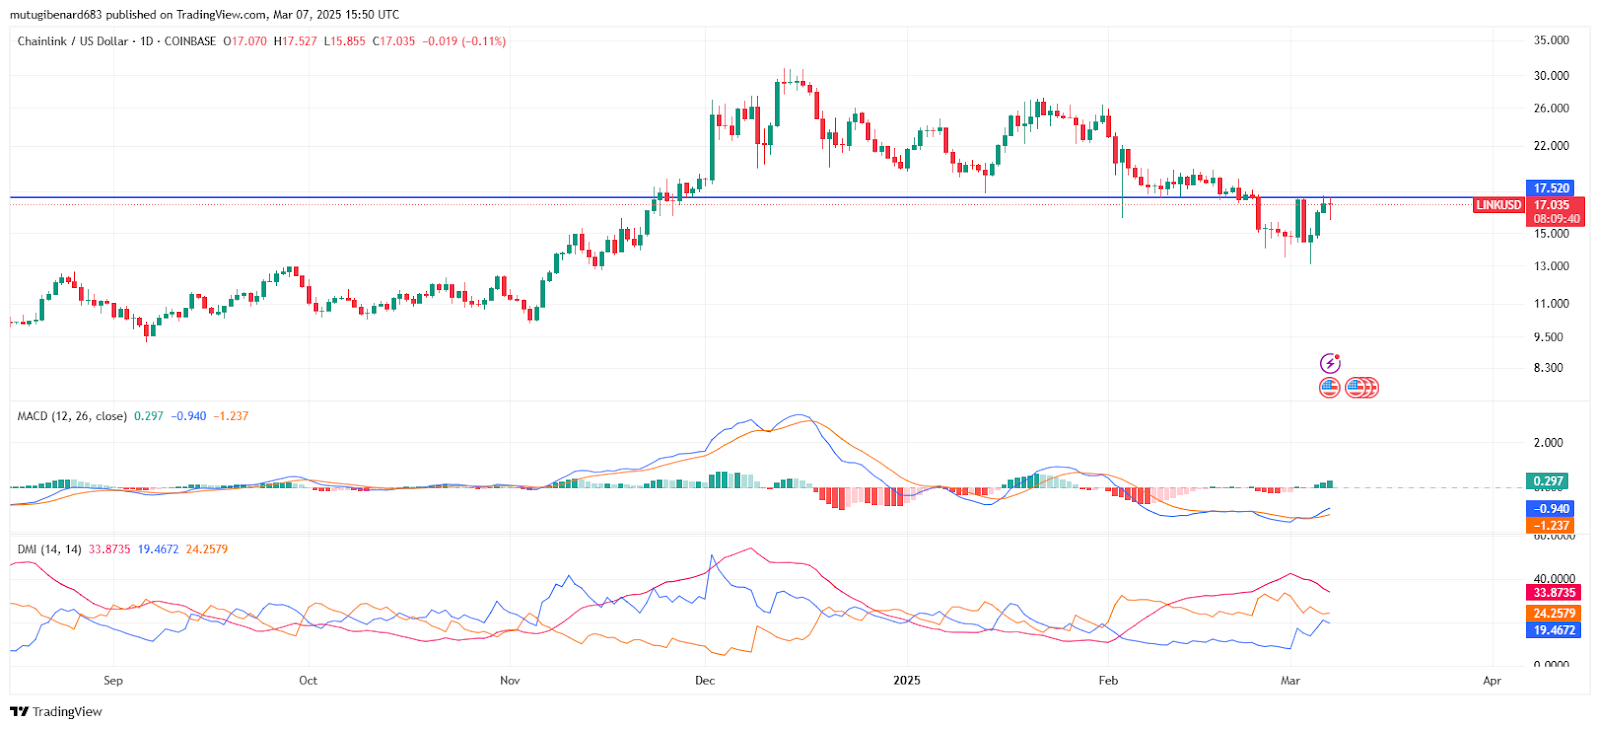
The price chart shows an initial decline followed by a sharp rebound. Recovery began around March 1, when the price surged from previous lows. A series of higher highs and higher lows emerged after the price bottomed out. This pattern suggests a transition in market behavior.
Ali_charts’s tweet points to a possible double bottom formation in LINK’s chart, a formation common in breakouts to indicate a bullish trend. The asset has seen a strong rally from its support level of $13.50–$14.00, with buying interest taking it to the $17.50 resistance level. If it crosses it, experts have $18.50–$19.00 as the next resistance level, with a breakout likely to take LINK to $21.
Support, Resistance, and Technical Data
Technical analysis identifies a support zone between $13.50 and $14.00. Price reversed sharply at this level during the recovery phase, confirming strong buying activity. A resistance zone near $17.50 is also observed, where the price has struggled to move higher. The current testing level is approximately $17.52.
MACD analysis shows the MACD line at 0.316 has crossed above the signal line at -0.916. The histogram has shifted from red to green, indicating rising buying pressure. DMI readings show the -DI at 24.2579 remains above the +DI at 19.4672, while the ADX is recorded at 33.87. These technical values are noted without offering further projections.
Market Outlook and Trading Data
Chainlink maintained a price value of $17.42 during writing with 3.01% daily growth and 23.15% weekly growth. The trading volume over the last 24 hours reached $1,451,326,067 in value.
If LINK can maintain its higher lows and break through $17.50, then the next resistance could be in the region of $18.50 to $19.00 towards $21. Not holding above $17.00 would result in a test of lower support in the region of $15.50 to $16.00.