
- ADA price movement reflects the 2020-2021 cycle, showing an illustrative accumulation phase before a potential breakout.
- ADA previously surged over 2,600% after consolidation, and a similar pattern may indicate another strong rally.
- The market structure stays intact, with ADA trading within a defined range, likely setting up for a parabolic move.
Cardano’s native token, ADA, is portraying a price pattern that closely mirrors its historical movement from 2020 to 2021. The current trend follows a similar structure but at a slower pace. During that period, ADA saw an accumulation phase before entering a parabolic rally. If this historical repetition continues, it could indicate a major price movement in the coming months.
ADA’s Historical Pattern Resurfaces
In the 2020-2021 cycle, Cardano exhibited a long accumulation phase before breaking out into an upward trajectory. The pattern involved a gradual price increase followed by exponential growth, which eventually resulted in a strong bullish phase. The present price structure reflects the same movement, albeit at a slower rate.
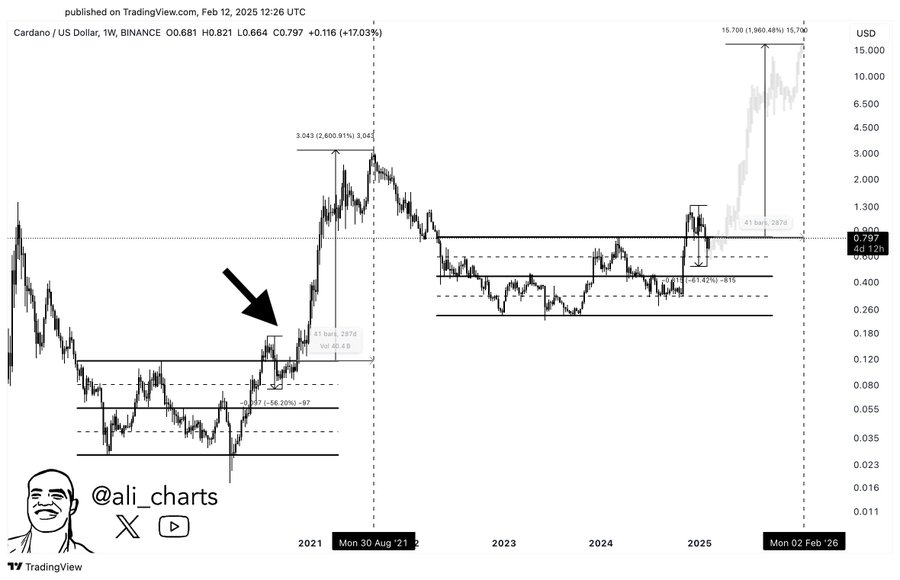
Ali Charts Cardano’s price movement observation on a weekly timeframe illustrates historical trends and potential future targets. A significant breakout in 2021 led to a peak of $3.043, marking a 2,600% increase. After a prolonged downtrend, the price found support near $0.24 before rebounding. The latest rally tested resistance around $0.90, with projected upside potential exceeding $10.
Market observations indicate that ADA is currently in a prolonged accumulation phase, similar to what was recorded before its previous rally. The token’s consolidation within a defined range for an extended period has drawn comparisons to the earlier market cycle.
Potential for a Parabolic Move
The observed similarities in market structure suggest that ADA could be preparing for a significant upward shift. Historically, a prolonged consolidation phase has preceded strong upward movements in Cardano’s price. If the trend continues, the next phase could see an accelerated price increase, much like the 2020-2021 period.
While the pace of the current cycle is slower, the structure remains intact. Traders and analysts tracking ADA’s historical trends have noted that such patterns have often led to strong market rallies. The extended accumulation period is viewed as a key characteristic that previously led to parabolic movements.