
- Cardano price remains above key channel resistance after a strong advance, keeping the broader bullish structure technically intact.
- ADA is testing $0.2222 support after reaching $0.23, with buyers needing stronger volume for another upside attempt.
- The $0.26 projection remains the next major reference, while losing $0.21 could weaken the current recovery structure.
Cardano price remains within a bullish technical structure after breaking its ascending channel, while traders monitor support, resistance, and weakening volume.
ADA breakout strengthens the broader structure
Alpha Crypto Signal reported that ADA’s ascending channel remained intact after a strong 50.20% advance. The update followed a bounce from the channel’s middle level. That move carried ADA toward the upper boundary before the eventual breakout.
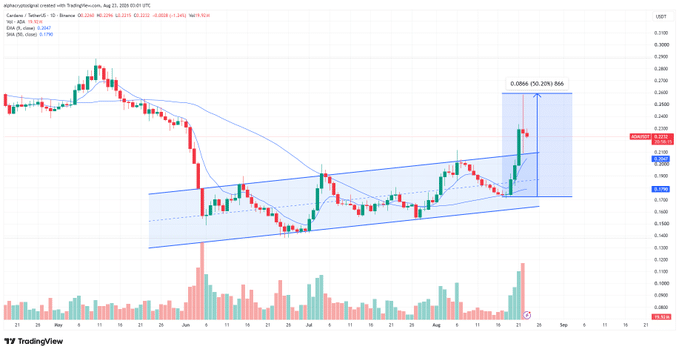
The daily chart shows several weeks of higher lows supporting the rising structure. Buyers repeatedly defended the lower channel boundary during earlier pullbacks. Consequently, each recovery created stronger support beneath subsequent advances.
Momentum accelerated as ADA approached the channel’s upper boundary. Trading volume also expanded during the latest upward movement. This combination accompanied the decisive move beyond established channel resistance.
The displayed projection places the next major upside reference around $0.26. That level follows an estimated $0.0886 measured move from the lower region. However, price must maintain support before that projection becomes technically relevant.
Current price tests important short-term support
ADA as of writing trades at $0.2241, according to the provided market data. The token is up approximately 0.94% over the reported 24-hour period. Its market capitalization stands near $8.22 billion.
Price previously advanced toward approximately $0.23 before encountering selling pressure. The subsequent decline pushed ADA toward the $0.21 area. Buyers then recovered much of that move, returning the price above $0.22.
The $0.2222 level now provides an important short-term reference. Holding above that area could support another test of $0.23. Conversely, renewed rejection could expose the $0.21 to $0.215 region.
Volume remains an important consideration during the latest recovery. Reported 24-hour volume stands near $637.2 million, down 60.28%. Therefore, stronger participation would provide clearer confirmation for another upward move.
Support retention determines the next move
The recent breakout needs confirmation through sustained trading above former resistance. A successful retest around $0.20 to $0.21 would strengthen the broader setup. Higher lows above that zone would also preserve the ascending structure.
The moving averages continue supporting the improved short-term trend. The shorter average has turned upward beneath the current price. Meanwhile, the longer average remains considerably lower around $0.18.
The small red candle near $0.22 shows some short-term hesitation. However, it does not yet establish a broader structural reversal. A sustained breakdown beneath former channel resistance would provide stronger bearish evidence.
For now, the chart retains a constructive structure above key support levels. A move through $0.23 could reopen the path toward the $0.26 projection. Conversely, losing $0.21 would weaken the current recovery and channel breakout thesis.