

- ADA has strong resistance at $0.7500, with an ascending triangle pattern suggesting a potential breakout or rejection.
- MACD shows bearish momentum, but diminishing selling pressure hints at a possible bullish reversal if buying strength increases.
- Support at $0.70 is important, holding this level could lead to a retest of $0.80, while a drop may push ADA toward $0.65.
According to analyst Ali, ADA is forming an ascending triangle pattern, which suggests a potential breakout. The digital asset has resistance near $0.7500, a level that has had multiple price rejections.
However, increasing buying pressure, with higher lows, indicates a possible upside move. If ADA breaks above this level, a 15% price surge could follow. Failure to sustain support could lead to a downturn.
ADA’s Imminent Breakout?
The ascending triangle pattern suggests bullish potential, provided ADA successfully surpasses the resistance.
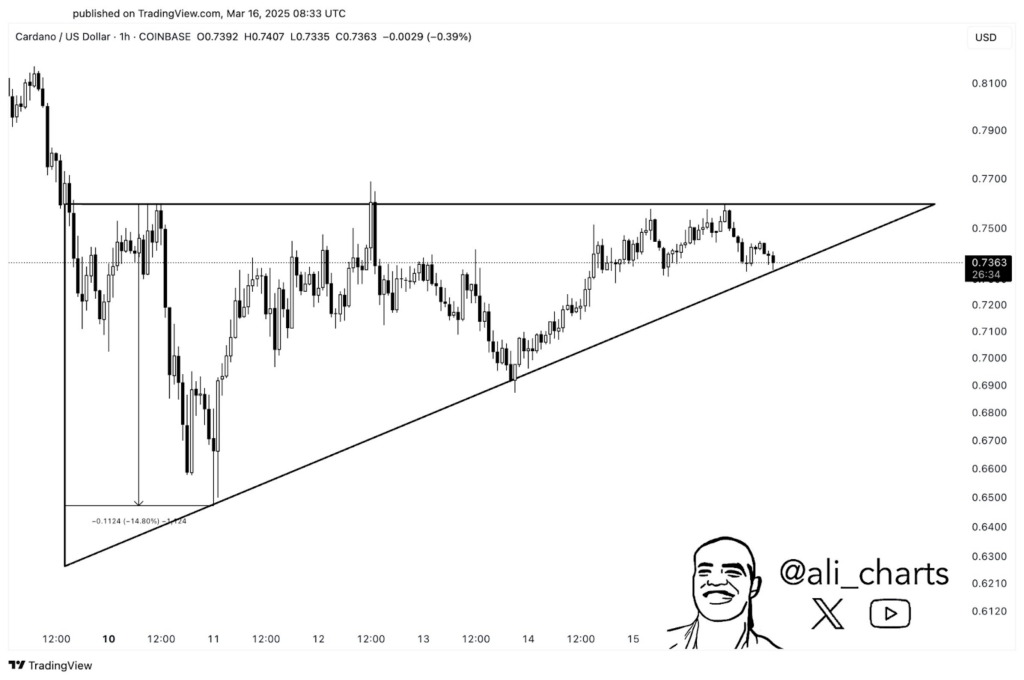
The horizontal resistance at $0.7500 has repeatedly stopped upward momentum, but the ascending trendline indicates consistent higher lows.
This pattern shows growing buying pressure, which may eventually force a breakout. ADA trades at $0.7363, with a high of $0.7407 and a low of $0.7335. It previously dropped by 14.80%, showing market volatility.
If ADA breaks past $0.7500, the next resistance zones are between $0.7700 and $0.8100. A drop below the trendline could push prices toward $0.7200 or even lower at $0.7100.
Market Trends and Indicators
The broader market has mixed momentum. Trading volume is at 32.03 million ADA, showing moderate market activity. The MACD line is at -0.0013, below the signal line at -0.0028, suggesting bearish momentum.
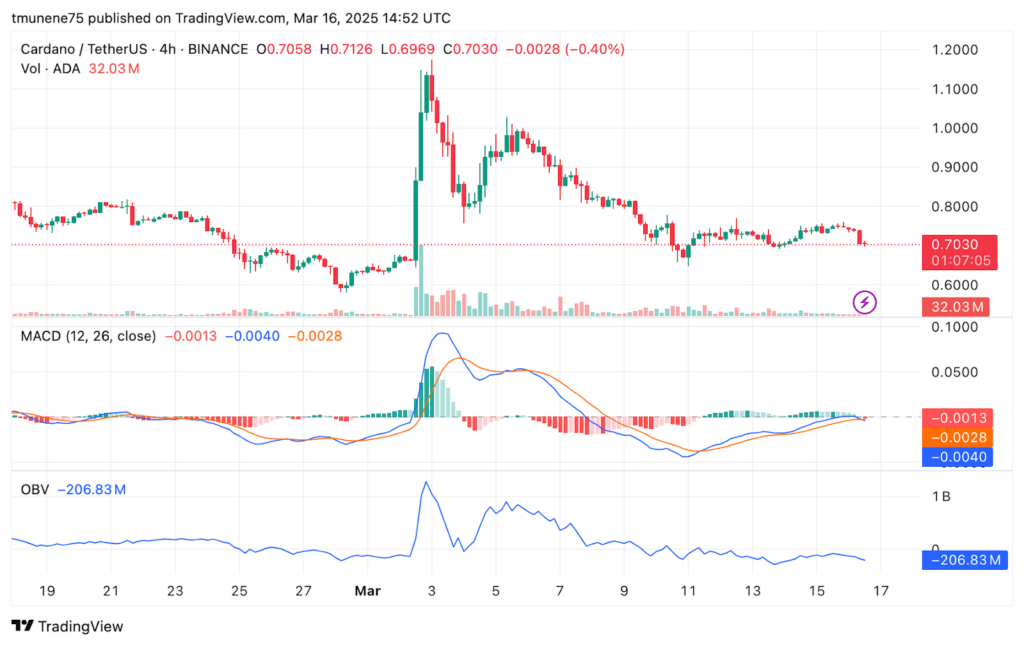
However, the histogram shows weak downward pressure, indicating a reduced selling strength. If the MACD crosses above the signal line, it could show a potential bullish reversal. The OBV indicator, at -206.83M, points to weak buying pressure. A previous surge in OBV led to ADA’s rally, but current trends suggest a lack of strong accumulation.
Support and Resistance Levels
ADA surged past $1.20 in early March before entering a correction phase. The price later consolidated within the $0.70–$0.80 range, struggling to reclaim higher levels. Price action indicates mild bearish momentum, with $0.70 being the short term support.
If ADA maintains support at $0.70 while trading volume increases, a potential retest of $0.80 could follow. However, a drop below this support could lead to further declines toward $0.65 or lower.