

- ADA’s TD Sequential buy signal hints at a rebound, but resistance at the 50-day EMA remains a key hurdle.
- Strong support at 0.7793 USDT is holding, while RSI at 40.80 suggests weak momentum but potential for recovery.
- A breakout above the descending channel could confirm a bullish reversal, but failure may lead to further declines.
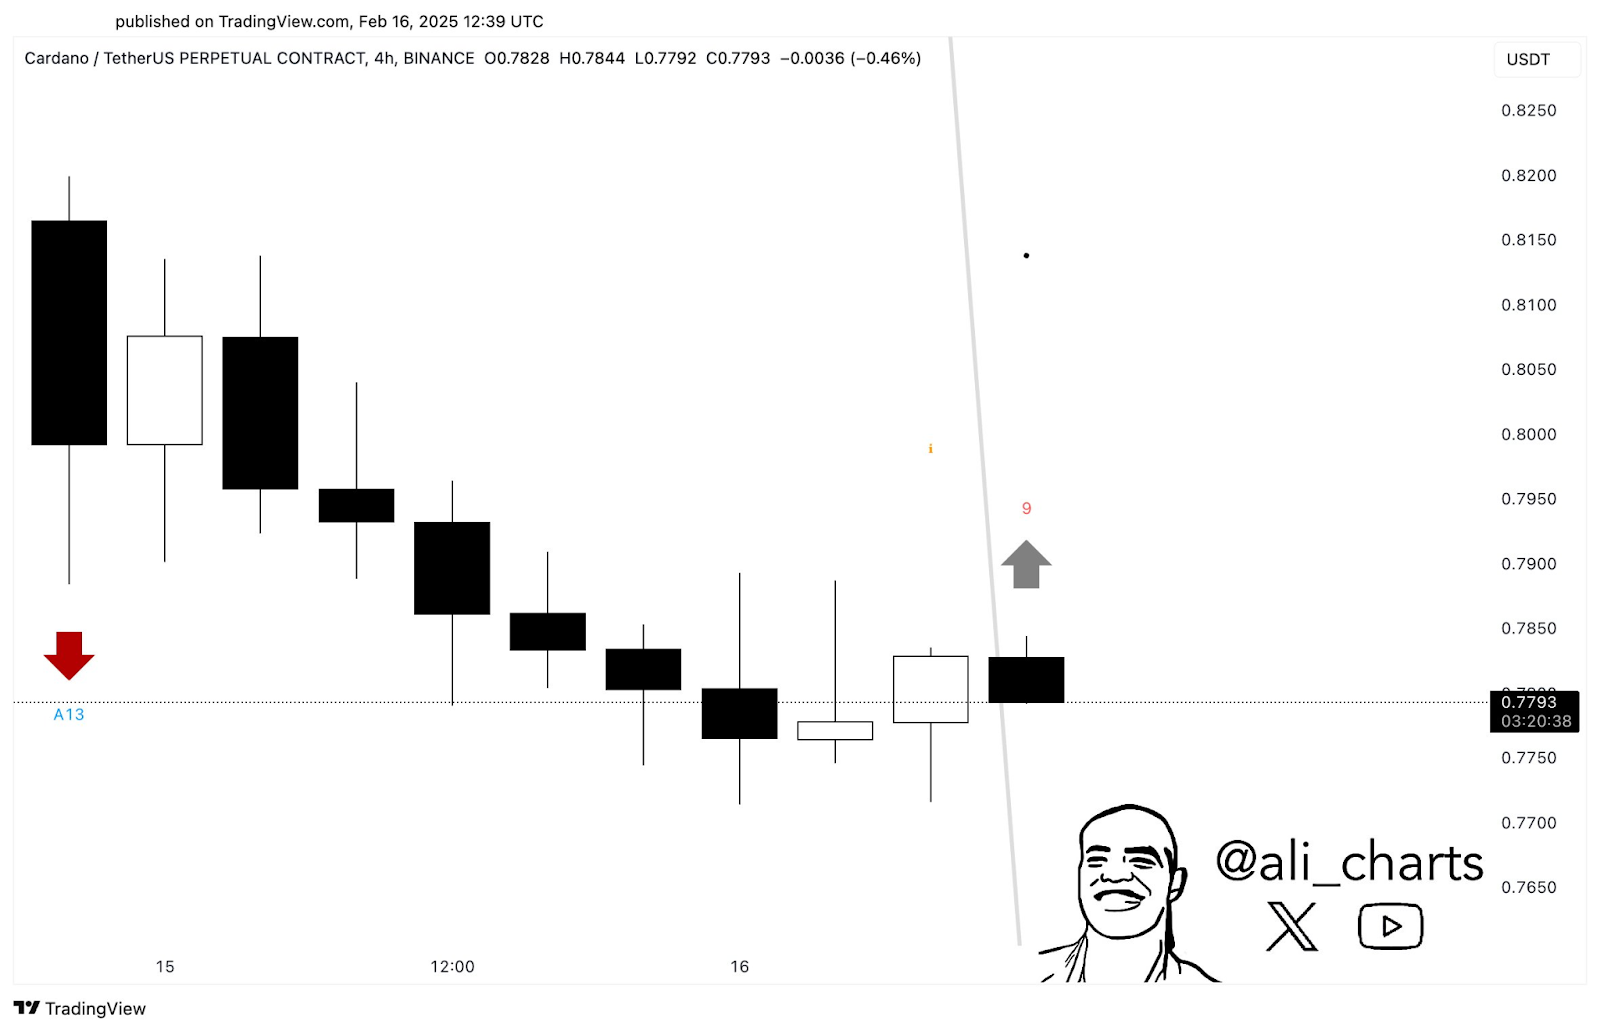
Ali, a cryptocurrency analyst has discovered a possible opportunity to purchase Cardano (ADA). His most recent study shows that the 4-hour chart’s TD Sequential indicator is flashing a buy signal. Although ADA has been down for a while, the current price movement points to a potential reversal. The price of the cryptocurrency is currently down 0.46% at 0.7793 USDT. Important technical indications suggest a change in momentum notwithstanding the dismal trend.
ADA Faces Bearish Pressure but Shows Stability
Cardano has experienced a downward trend in recent sessions. Multiple black candles indicate strong selling pressure, pushing the price lower. However, the presence of smaller-bodied candles near the current price level suggests reduced bearish momentum. The support level around 0.7793 USDT has held firm, preventing further declines. Additionally, an upward gray arrow and a red “9” signal indicate a possible price recovery.
Weak momentum is indicated by the Relative Strength Index (RSI), which is currently at 40.80. It has stayed below 50, indicating ongoing pressure to sell. But the RSI had already fallen to 34.35, suggesting that the market was recently oversold. ADA might see a resurgence if the momentum picks up. Additionally, during the latest price decline, trade volume increased to 28.34 million, indicating robust market activity.
Crucial Resistance Levels and Moving Averages
The price is currently trading below the 50-day Exponential Moving Average (EMA), which stands at 0.8667 USDT. This moving average is acting as a strong resistance level. If ADA breaks above this barrier, it may test the upper boundary of the descending channel. Besides, the highest price recorded in the session was 0.7895 USDT, while the lowest stood at 0.7618 USDT.
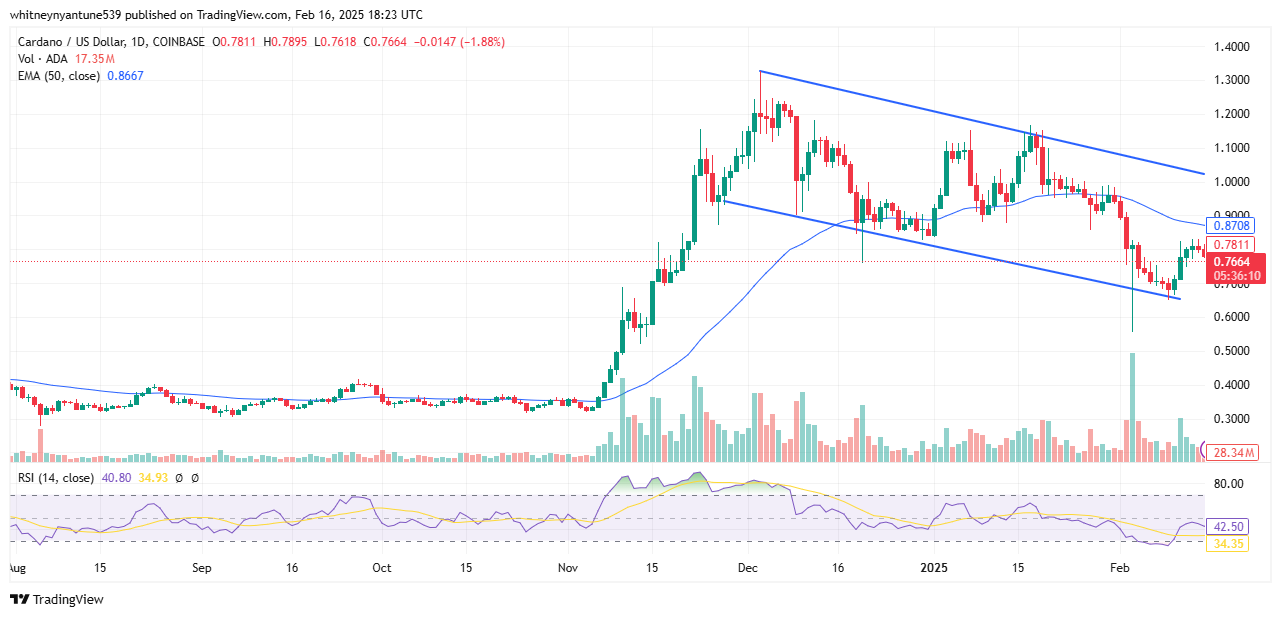
Additionally, price fluctuations remain within a descending channel. The trendlines define critical resistance and support zones that will determine ADA’s next movement. A breakout above resistance could trigger a bullish reversal, while failure to hold support may extend losses.
Market Outlook: Rebound or Further Decline?
ADA’s short-term outlook remains uncertain. The TD Sequential buy signal suggests a possible reversal, but confirmation is needed. To validate an upward trend, buyers need to lift the price over the 50-day EMA. On the other hand, ADA might test lower support levels if selling pressure continues. For more information, traders should keep an eye on important technical indicators.