
- ADA consolidates within an ascending triangle near $0.7969, needing volume confirmation to break resistance at $0.8084.
- The RSI at 43.01 signals bearish conditions, but recovery from oversold levels suggests a potential momentum shift.
- MACD hints at a bullish crossover; a breakout above $0.81 could push ADA toward $0.90, while failure risks a drop to $0.70.
Cardano (ADA) is trading near key Fibonacci levels. According to analyst Ali, ADA is consolidating within an ascending triangle, up for a potential breakout. However, confirmation is essential to determine the next move. At press time, ADA was trading at $0.7967, a 2.68% decline in the past 24 hours.
Fibonacci retracement levels show important support and resistance points. The 0.236 level is at $0.7714, followed by 0.382 at $0.7810 and 0.5 at $0.7890. The 0.618 level at $0.7969 is an important zone, while the 0.786 level at $0.8084 is the resistance barrier.
Extension levels suggest possible future targets at $0.8321, $0.8427 and $0.8679. A rising wedge pattern is evident, forming with higher lows and converging resistance near $0.83. This pattern suggests bearish reversal unless buying pressure overcomes resistance.
Price Struggles
ADA is consolidating around the 0.618 Fibonacci level at $0.7969, with resistance at $0.8084. The price must break past this level to target the next resistance at $0.8321. Failure to hold support near $0.7890 could push ADA toward $0.7810 or even $0.7714.
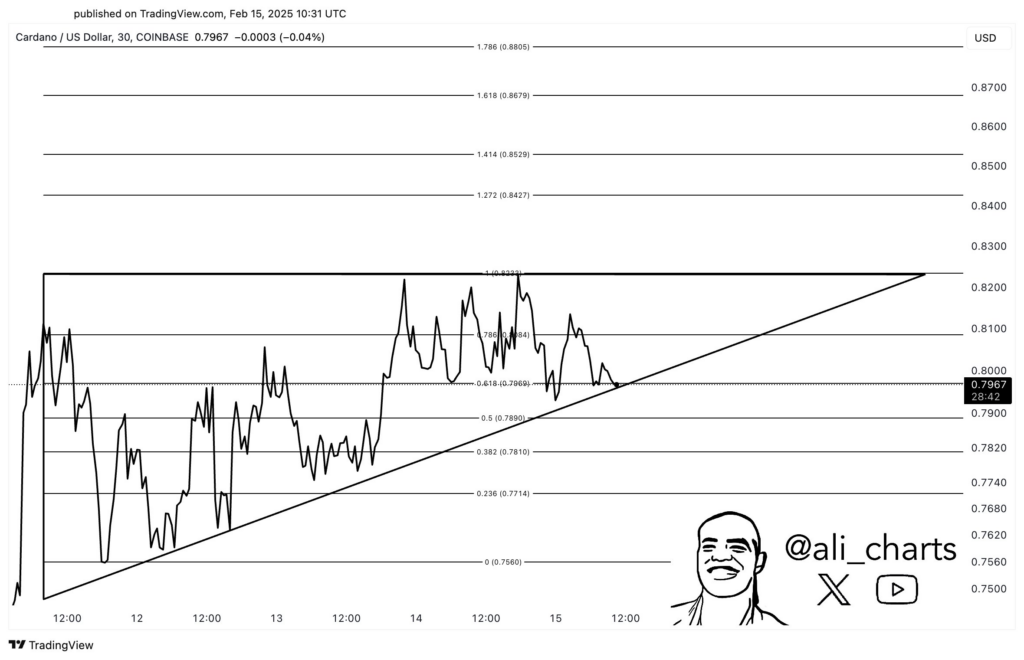
The rising wedge suggests potential downside pressure unless volume confirms an upward breakout. On the daily timeframe, ADA tested $0.8141 but had selling pressure, pulling it down to $0.7798 before stabilizing.
Ther trend is bearish, with declining highs since ADA peaked near $1.40. However, buyers have stepped in after ADA dropped below $0.60, hinting at a possible reversal. The 50.19M daily trading volume indicates moderate activity. The recent surge in volume suggests strong buying interest at lower levels. If sustained, this could support a reversal.
Momentum Indicators
Momentum indicators show ADA’s uncertain position. The 14 day RSI is at 43.01, below the neutral 50 level, indicating a bearish outlook. However, the RSI has recovered from oversold levels of 34.25, hinting at possible upward momentum.
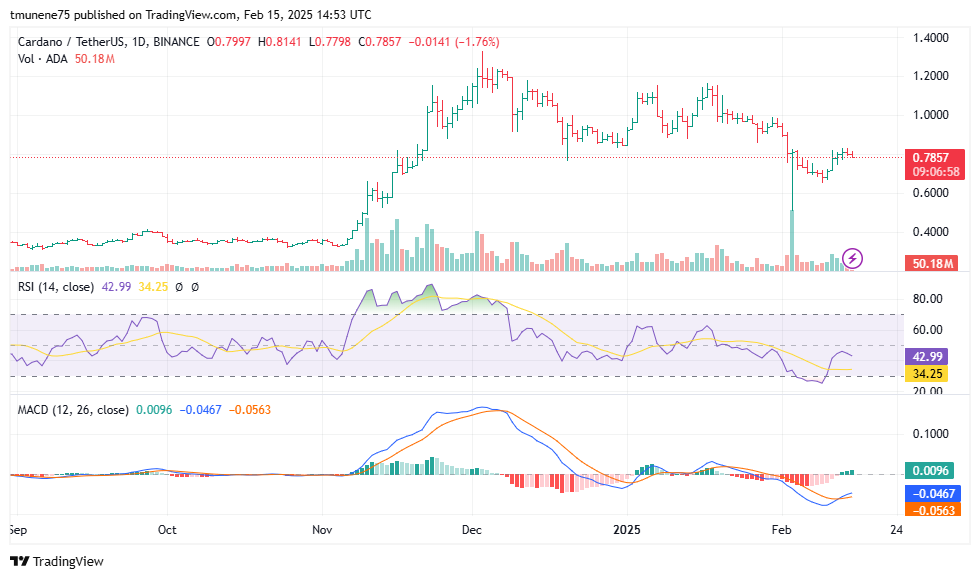
The MACD shows early signs of a shift. The MACD line is at 0.0096, while the signal line is lower at -0.0467. The histogram at -0.0563 indicates bearish conditions, but the MACD line is attempting to cross above the signal line. If this crossover occurs, it could confirm a bullish shift.
If ADA successfully breaks above $0.81, it could rally toward $0.90 or $1, supported by RSI improvement and a MACD crossover. However, failure to hold $0.78 could lead to a retest of $0.70 or lower. ADA is at a decisive point, requiring strong volume and confirmation for an upward move.