
- Bitcoin recorded four consecutive bullish March performances, demonstrating recurring seasonal strength and inspiring robust market confidence for another rally in this period.
- Current technical indicators, rebound above the 200-day EMA and oversold Stochastic RSI readings, reinforcing expectations for a renewed upward trend in Bitcoin.
- Historical seasonal trends and current price action suggest market participants expect bullish performance in March, reinforcing a strong base for Bitcoin’s rally.
Bitcoin has drawn considerable attention as historical data shows four consecutive bullish March performances. Current technical signals and seasonal trends suggest that history may repeat itself this month, with past patterns likely to influence the current price action.
Historical March Trends
A recent tweet from Mister Crypto, a prominent Bitcoin and altcoin trader and investor, stated that March has been bullish for Bitcoin for four consecutive years. The Coinglass chart displays positive percentage returns in recent March periods.
Data from the chart shows that Bitcoin closed March in the green over the past four years. This recurring pattern occurs even when earlier months experience volatility. Traders use these observations to identify a season of renewed market strength and rising buyer sentiment.
Historical records indicate that March consistently produces gains, reinforcing the idea that market cycles may repeat. The positive returns observed during March form a reliable benchmark for anticipating future price moves. This seasonal performance has become a reference point for market participants.
Current Price Action and Key Indicators
The daily chart for March 1, 2025, shows Bitcoin trading near $85,217.84 at press time after a recent bounce. The price dipped below the 200-day EMA before recovering above it.
The 200-day EMA, currently at $83,810.75, serves as a critical support level. Bitcoin’s recovery above this line suggests that buyers are active, echoing patterns seen in previous bullish March periods. Recent technical movements offer a basis for expecting similar seasonal strength.
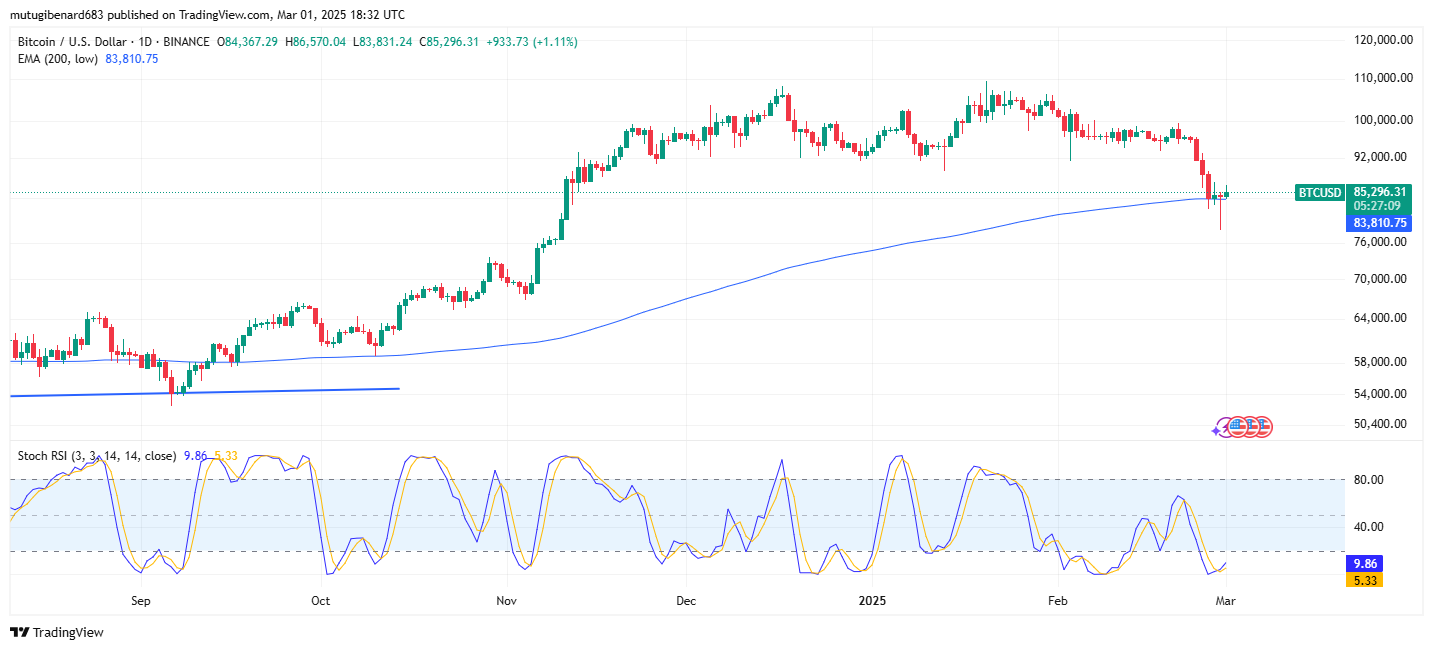
Stochastic RSI readings of 9.53 (blue line) and 5.22 (yellow line) remain in the oversold territory. These low values indicate that selling pressure has waned. Technical indicators suggest that momentum may shift as the market responds to seasonal trends.
Market Outlook and Seasonal Trends
Historical trends and current technical data reinforce a bullish outlook for March. Traders anticipate that the current price action will align with past performance, potentially triggering renewed upward momentum.
If Bitcoin maintains its position above the 200-day EMA and the Stochastic RSI turns upward, price recovery toward $90,000 or higher appears likely. According to coin gecko data, the current 24-hour gain of 1.84% at the time of writing and strong support levels offer further evidence. Despite a 7-day decline of 11.70%, market participants remain attentive to seasonal patterns that have proven effective in previous years.
Market participants continue to monitor these technical signals and seasonal trends as they converge, offering a clear reference point for potential price recovery. Historical performance and current data together set the stage for a potentially bullish March for Bitcoin.