
- Bitcoin trades within a symmetrical triangle, with lower highs and higher lows, suggesting a continuation of its preceding trend and price momentum.
- MACD data shows mild bearish signals, while RSI remains near neutral levels, indicating the market awaits a decisive directional trigger for momentum.
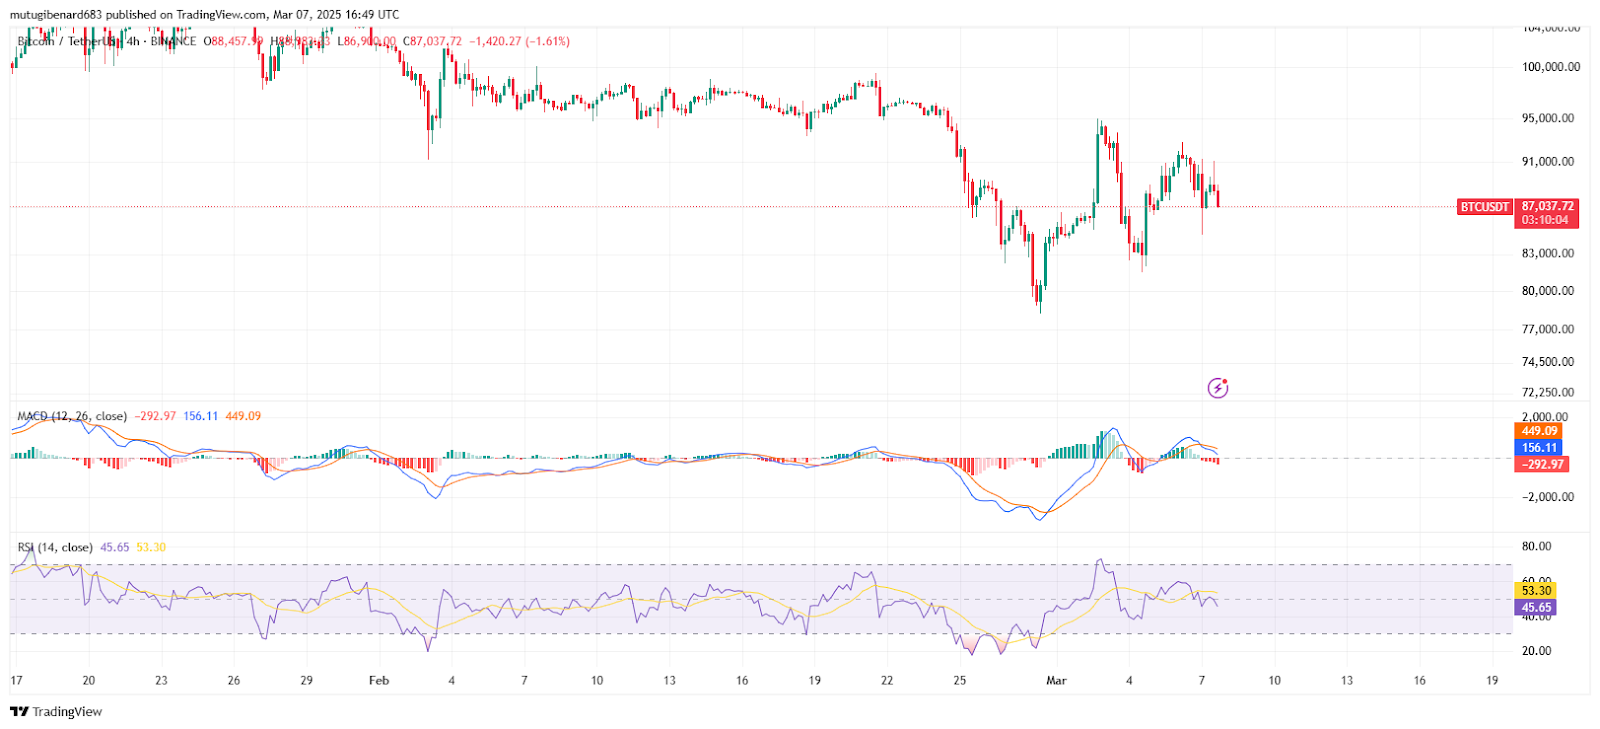
- Bitcoin hovers near $87,606 with a 3.04 percent daily drop, suggesting short-term weakness in trader sentiment before a potential breakout or further consolidation.
Bitcoin has a technical crossroads that’s very important as it forms a symmetrical triangle formation. Recent trading figures and key support and resistance levels are being eyed intently amid conflicting signals and volatile prices.

Symmetrical Triangle Formation
A tweet by JAVONMARKS stated that Bitcoin is pushing toward a breakout of this pennant pattern. The tweet draws attention to the triangle formation. Traders record the structure as a potential setup for a breakout in either direction.
The chart shows a series of lower highs and higher lows. These movements form a symmetrical triangle. This pattern continued the previous bearish trend before the triangle emerged. The structure suggests a breakout may occur with the right momentum.
Technical Indicators and Key Levels
Technical data shows Bitcoin testing the upper trendline of the triangle. The upper boundary acts as a key resistance level. A strong move above may signal a bullish trend. The current price action is measured against these levels.
Support is found along the lower trendline, which has recorded past rebounds. The MACD shows a negative crossover with the MACD line at 192.24 and the signal line at 456.31, which implies a possible bearish pattern. The histogram is negative at -264.07. Meanwhile, the RSI stands at 46.83 near the neutral zone.
Market Scenarios and Trading Data
Bitcoin was at $87,606.43 at press time with high trading volume. The asset experienced a 3.04% decline in the last 24 hours. It has gained 4.10% over the past week. These figures reflect mixed short-term performance.
The price of Bitcoin stands at its most critical level when trading at $91,000, while its range of support exists between $83,000 and $85,000. If BTC manages to surpass $91,000, it might initiate an upward trend toward $100,000. A drop below $83,000 could trigger retracement. Traders monitor these levels closely.
Bitcoin’s technical formation remains critical as traders await a clear breakout or breakdown.