
- OGN is trading within an ascending channel, with a breakout above $0.080 possibly pushing the price toward the $0.10-$0.12 range.
- The RSI at 42.15 suggests neutral sentiment, while MACD hints at weak bullish momentum, requiring confirmation for a breakout.
- A breakdown below the support of $0.074 could indicate a decline to levels of $0.065, a major key to determining the next price movement direction.
Origin Protocol (OGN) is trading within a bullish ascending trend channel on the 4-hour time frame with the potential to break out to the higher side. The price is at a major support area with traders patiently waiting for a strong movement to occur. OGN is 0.80% higher within the last 24 hours, although 5.49% lower within the last week.
Price Action and Key Levels
A recent tweet on X from Alpha Crypto Signal pinpointed the price action of the token OGN, saying that the token is at a significant chop area inside of a bullish trend channel. The two potential setups are a break out of the resistance with a potential long opportunity or a breakdown of the support with a short setup.
At the time of writing, the price was trading between $0.075 to $0.080, a well-set support area. Historically, this price level served strong support that resulted in a number of price rebounds.A bullish breakout above $0.080 – $0.085 would create a possibility for the price to reach $0.09 – $0.10. The price decline will extend to $0.070 – $0.065 levels when it drops under $0.074.
Technical Indicators Shows Mixed Signals
The Relative Strength Index (RSI) is 42.15 with a slightly bearish to neutral sentiment. It is coming off oversold levels, so a relief bounce can’t be ruled out. If the RSI again approaches 50 levels, bullish strength can pick up speed.
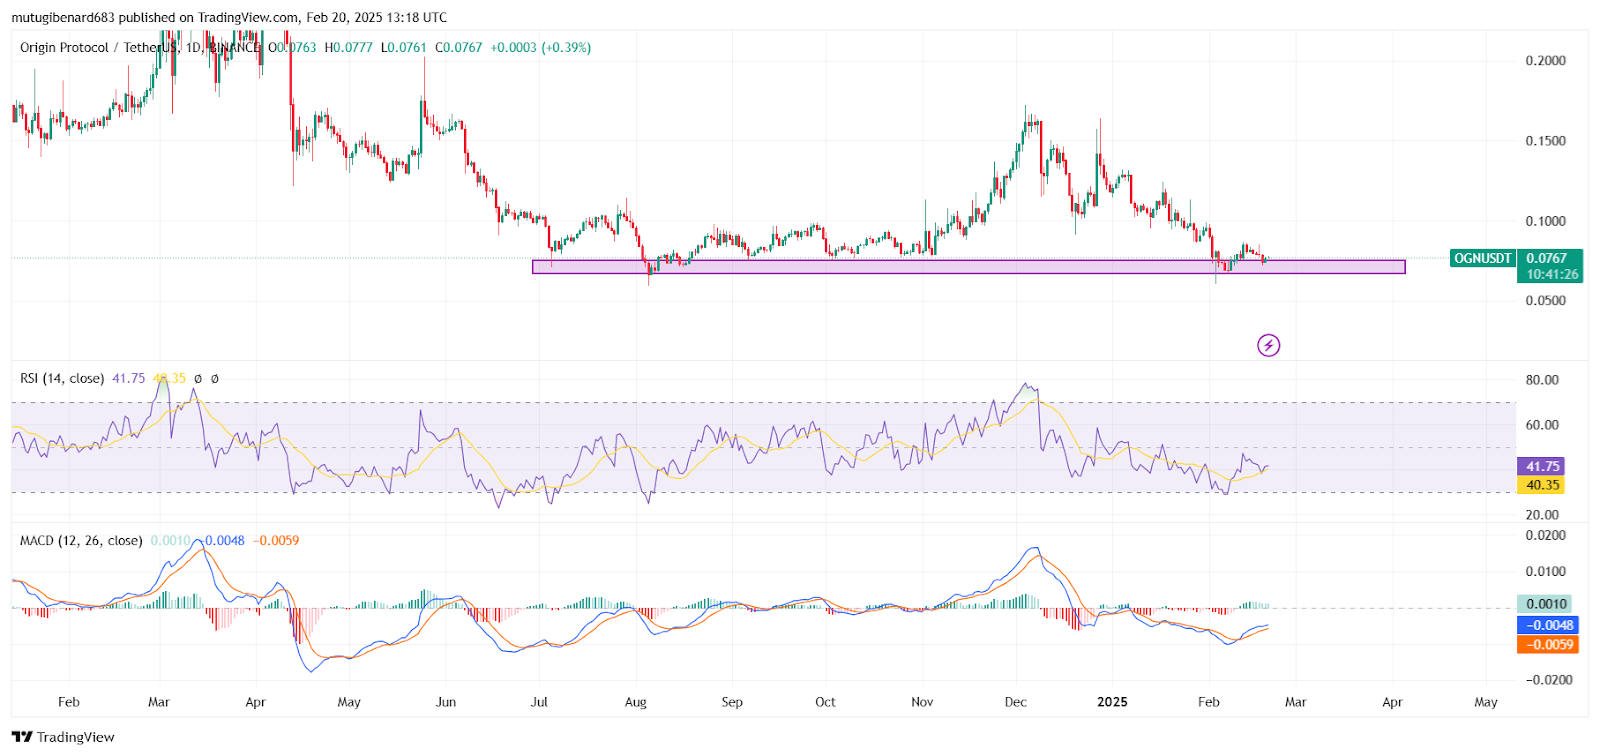
The MACD is showing a weak bullish cross with the MACD line slightly higher than the signal line. Histogram bars remain at a value of zero, meaning that the momentum is also not strong either way. Strong bullish strength will be established by a stronger cross with growing histogram bars.
Traders are recommended to look out for a confirmation of the breakout at $0.080 – $0.085. Breakout above this price could aim at $0.10 – $0.12. Breakdown below $0.075 could initiate a fall to $0.065 – $0.060.
With OGN at a key support area, price action within the next couple of days will indicate if it will go with a bullish continuation or bearish reversal. Both volume and momentum metrics will play a key role in validating the next significant movement.