
- Bonk (BONK) has shown signs of a reversal, with TD Sequential flashing a buy signal and a bullish engulfing pattern forming.
- Technical indicators, including oversold Stochastic RSI and stable VWAP, suggest potential upward movement if buyers sustain momentum.
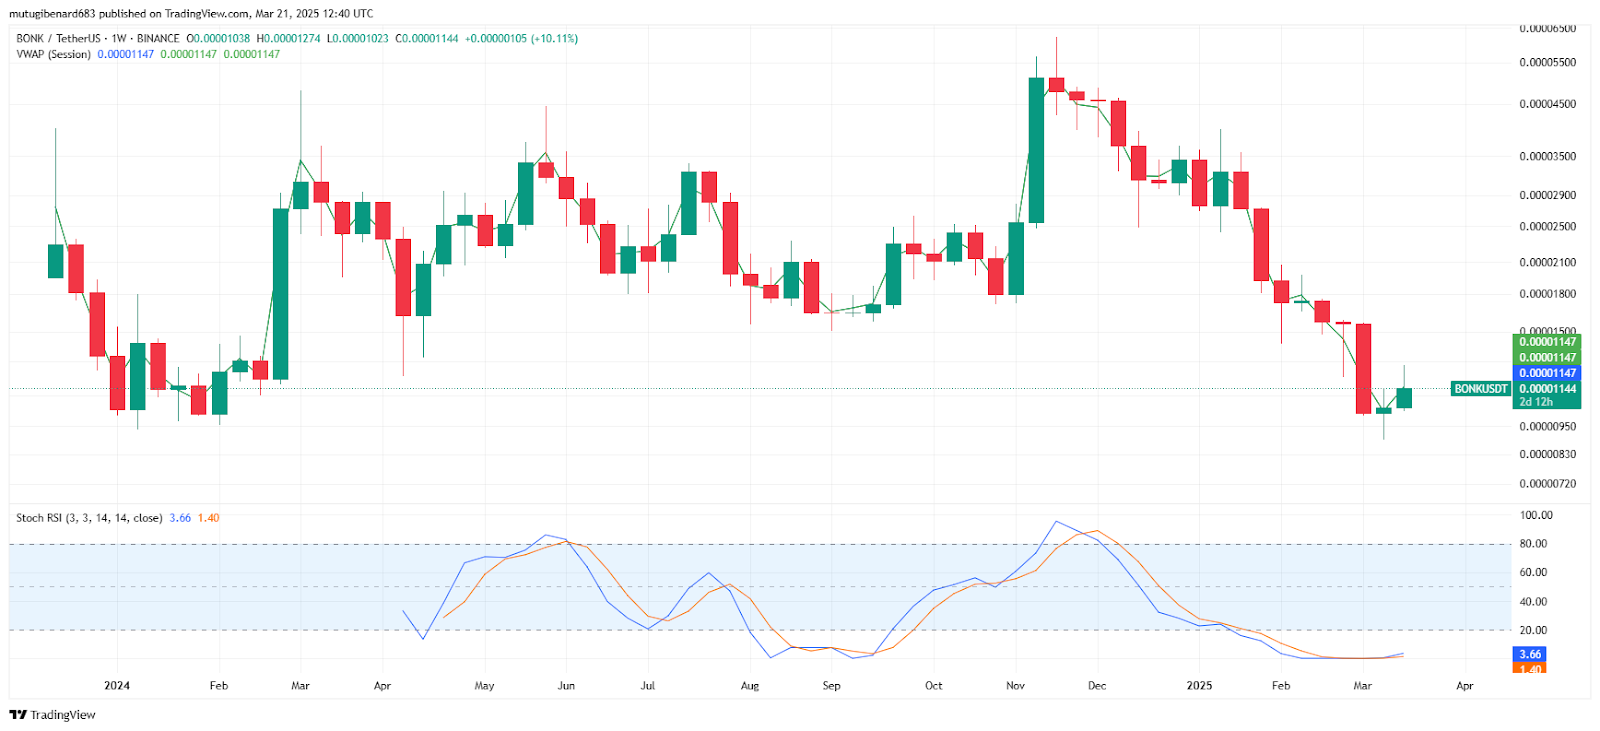
- Key support at $0.000010229 and resistance near $0.00001270 will determine whether BONK continues its recovery or faces further challenges.
Bonk has been in a consistent bearish trend that is now showing cautious reversal signals. Technicals and recent prices are suggesting that a short-term reversal is ongoing and is closely monitored by market participants.
Market Sentiment
Crypto analyst Ali_charts noted on X that “$BONK is about to bounce! TD Sequential indicates a buy on the weekly chart.” This is a tweet that shows there is a potential turn in favor of buyers. There were consecutive bearish candlesticks for weeks and it was a clear downtrend. Now there is a recent white candlestick that indicates increasing buying pressure.
The last weeks are depicted by lower highs and lower lows on the price chart. A long lower wick on the last candle is a formation that signifies that buyers are entering on lower prices. This is a signal that selling pressure is subsiding. Investors observe these developments with caution.
Technical Overview
The TD Sequential indicator has displayed a number 9 on top of the recent candle. This is a sign of a possible exhaustion of the downtrend. The chart is now showing bullish reversal signals like a bullish engulfing pattern. Such technical patterns are recognized by experienced analysts.
Along with this, the VWAP is approximately 0.00001150 USD. This support is in favor of a potential move higher. Stochastic RSI is registering deep oversold levels with the blue line registering 3.87 and orange line registering 1.47. Both of these levels are indicative of waning selling pressure.
Key Price Levels
Support is found close to the recent low of $0.000010229. If it falls below this point, the downtrend can resume. The psychological support range is between 0.00001000 and $0.00001100. Traders regard this range as crucial for maintaining momentum.
Resistance is on the downward trendline and around 0.00001270 USD. A close above this resistance would open the way for further advances. The price can target higher resistance around 0.000014000 and 0.000017000 USD. Investors are closely monitoring these levels and deciding what to do with the market.