

- The TD Sequential “9” signal suggests selling momentum is weakening, hinting at a possible bullish reversal for BONK.
- BONK’s key support zone remains between $0.000016500 and $0.000016700, with resistance at $0.00004108 indicating a 220.88% potential rise.
- RSI at 32.45 nears oversold conditions, historically signaling rebounds, making a short-term recovery a possibility for BONK traders
Bonk (BONK) has shown signs of a potential trend shift after the TD Sequential indicator flashed a buy signal on its daily chart. The current price movement suggests a crucial phase for traders, with a possible rebound or further decline based on market conditions.
A tweet from Ali highlighted that the TD Sequential indicator has flashed a buy signal on the BONK daily chart, pointing out a possible price rebound. The tweet also mentioned key support and resistance levels that traders should monitor.
TD Sequential Indicator Signals Potential Rebound
The TD Sequential indicator, tracking price trends for reversal points, flashed a “9” in red in the daily chart. That signifies a deceleration in momentum in selling, and a move towards buying pressure is in view. On February 2, a long wick validates buying at low price values, re-affirming a significant level of support between $0.000016500 and $0.000016700
If this marker holds, then a short-term bullish reversal for BONK can be predicted, with a target between $0.000019000 and $0.000020000 in terms of resistances. Not breaking resistances such as these can result in a continued downtrend, with a new target for a supporting level at $0.000015000.
Key Support and Resistance Levels
The price is currently hovering above the lower boundary of the highlighted support range. Historical data indicates that this level has acted as a strong support zone, with multiple bounces in the past.
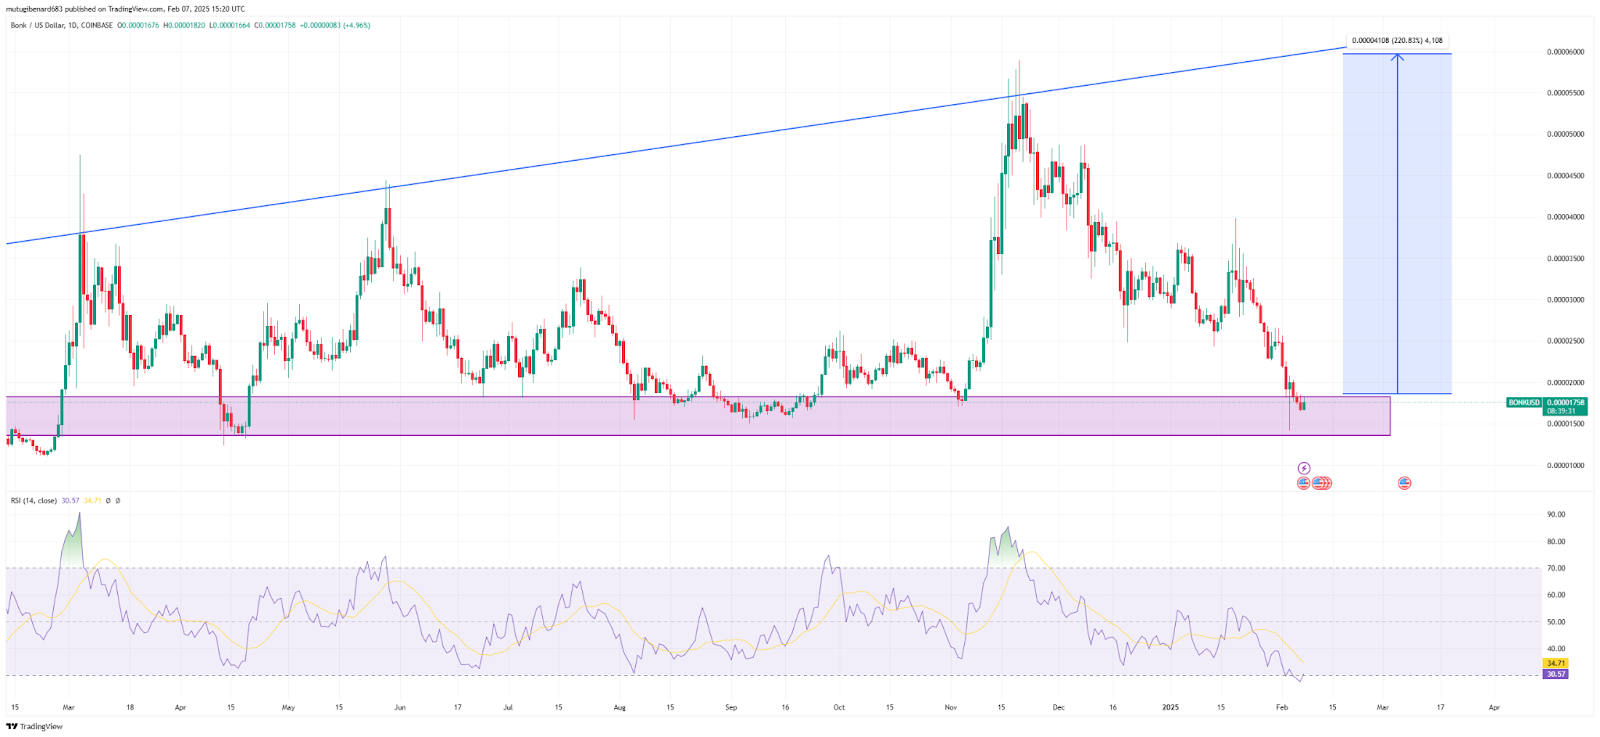
A resistance trendline suggests a broader ascending trend, with the next potential resistance target at approximately $0.00004108. If buying power increases, BONK could see a substantial upward movement, marking a 220.88% potential increase from current levels.
RSI Indicator Nearing Oversold Conditions
The Relative Strength Index (RSI) is currently at 32.45, approaching the oversold threshold of 30. Historically, price rebounds have followed RSI levels nearing oversold conditions, indicating the possibility of a recovery if the trend remains consistent.
The moving average remains slightly above the RSI, suggesting weak momentum. If RSI trends upward, it could confirm a shift in market sentiment, further supporting a potential price increase.
Market Outlook and Future Trends
If the current level of support holds, then BONK can head towards a rise at $0.00004108. However, in case of a fall below $0.00001500, then a fall can happen, and new lows can then follow.
Given the current price level of RSI and its previous level of support, a short-term reversal cannot be eliminated. As of publication, Bonk is trading at $0.000018 with a 24-hour trading value of $143,064,843. Over the last 24 hours, Bonk rose 1.11%.