

- The TD Sequential indicator flashes a sell signal, suggesting a potential reversal as BNB tests resistance near $720 after recent gains.
- The powerful rise of BNB could face rejection at its upcoming resistance threshold, which would trigger downward price movements if it fails to break through.
- The price appears to be currently stretched too far based on the overbought reading from the Stochastic RSI thus creating a higher probability for market consolidation or a pullback.
On the 12-hour chart, Binance Coin (BNB) displays a TD sequential sell signal, which forecasts an upcoming market reduction. After breaking past its fundamental support areas, Binance Coin exceeded $720 to test vital resistance levels.
TD Sequential Indicator Flashes Sell Signal
A recent tweet from Ali highlighted that the TD Sequential indicator has printed a sell signal on BNB’s 12-hour chart. This signal, marked by a “9” count, often suggests a local top and potential exhaustion of the current uptrend.
The latest large bullish candle reinforced another TD 9 sell signal, indicating that BNB’s rally may be overextended. Historically, this pattern has preceded market corrections, suggesting that a short-term pullback or consolidation could follow.
Key Support and Resistance Levels
BNB has shown strong price action, bouncing off a crucial support zone between $540 and $560. This area has repeatedly acted as a demand zone, preventing further downside. Buyers stepped in at these levels, driving the price upward.
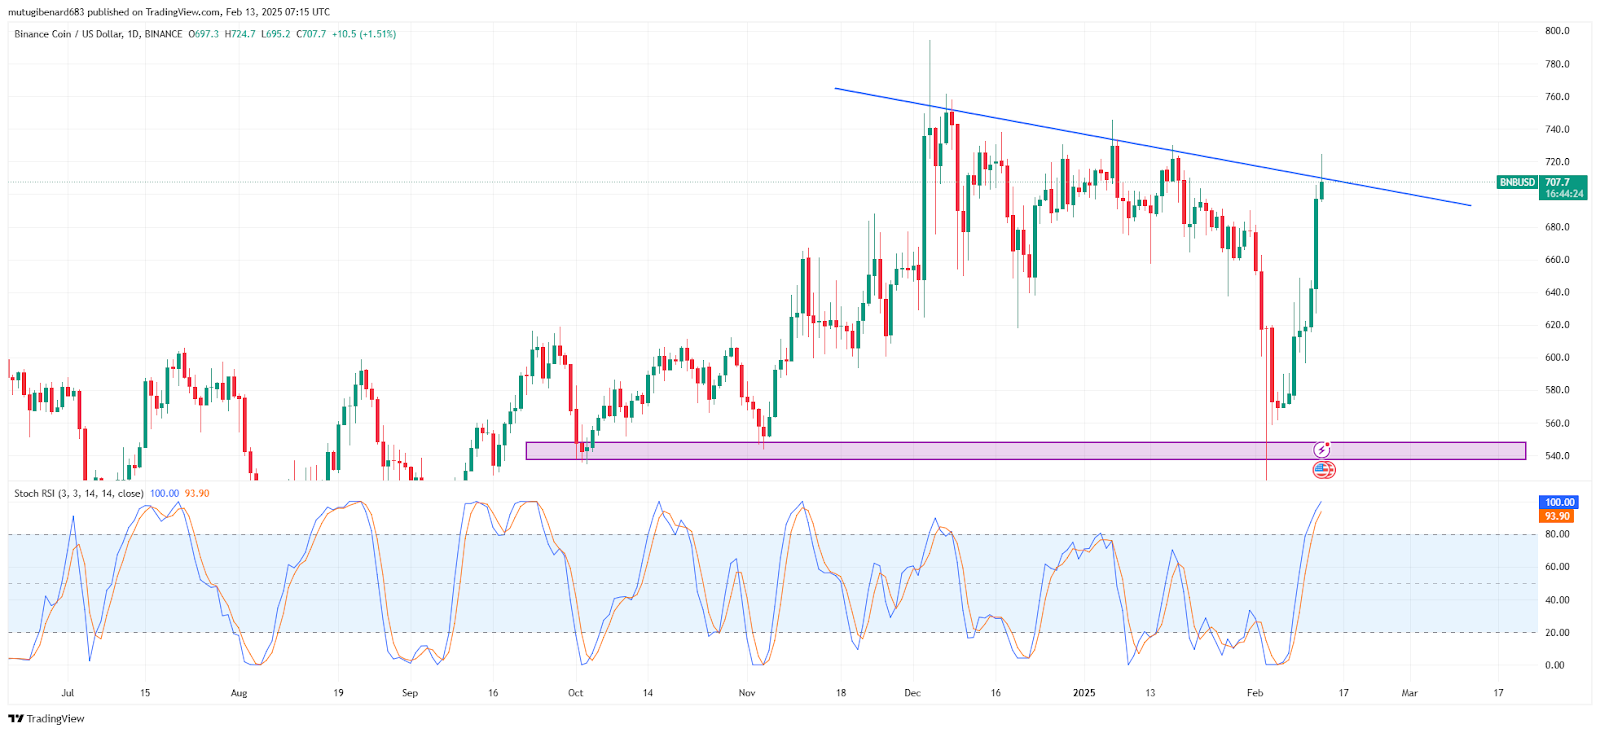
However, the asset now faces a descending trendline resistance at approximately $720. This level has rejected previous breakout attempts. If BNB surpasses this resistance, the next targets lie at $750 and $800. On the other hand, a failure to break through could result in a drop back to $640 or lower.
Stochastic RSI Signals Overbought Conditions
Technical indicators suggest BNB may be nearing a temporary top. The Stochastic RSI currently stands at 100.00 (blue) and 93.90 (orange), indicating overbought conditions. When this momentum oscillator reaches such elevated levels, it often signals an upcoming retracement or consolidation period before another significant move.
Possible Market Scenarios
A breakout that occurs above the $720 price point would likely validate additional upward movement, so investors should focus on $750 and then after $800 as the following resistance levels. A rejection at $720 could drive the price to return within the $640-$660 area. This downtrend may broaden if BNB drops below $600.
At the time of writing, The BNB token trades for $706.75 after experiencing an 11.94% surge during the past day and a 23.05% increase this week. Observers of BNB market activity are focusing on its resistance points along with technical indicators to establish viable forecast patterns.