

- Bitcoin’s trading data reveals the market price remains well below the realized price, showing that many short-term traders are currently facing losses.
- Technical indicators such as RSI and MACD suggest that bearish momentum persists while the gap between support and resistance remains critical.
- Key support levels near $85K and resistance between $90K and $92K shape market forecasts, while a trading volume surge reinforces Bitcoin’s dynamic market activity.
Bitcoin’s trading data indicates a critical market phase, with traders holding significant losses. Current price action and technical indicators suggest that the market could either rebound or decline further, prompting close attention from market participants.
Technical Analysis Overview
Bitcoin’s realized price stood at $99,438 per coin on March 4, 2025. The market price was recorded at $84,141 on the same day. A profit/loss margin of -15.38% signaled that many traders were at a loss. The 30-day moving average of the margin remained at -4.14%.
A recent tweet by Ali Martinez indicated Bitcoin rebounded at a -12% trader loss margin. The current margin of -15.4% raises the possibility of a market reversal. Market data shows traders have faced losses over short periods. The statistical analysis offers insights for technical observers.
This technical data assists investors in monitoring market conditions. The price gap suggests trading activity is under pressure. Observers use these metrics to gauge market trends.
Trader Sentiment and Historical Trends
The market price remains significantly below the realized price on March 4, 2025. Many short-term traders have incurred losses on their Bitcoin holdings. Historical data from early and mid-2023 shows negative margins preceded market recoveries. Analysts monitor these trends closely to track market behavior.
The tweet from Ali emphasizes potential market reversal. Traders may see a short squeeze if Bitcoin reclaims its realized price. The analysis compares current data with past recovery phases. These trends offer a view into market dynamics.
Data from past market cycles provides context for current trader behavior. The recovery phases in previous years offer historical references. Market participants observe similar patterns today.
Support, Resistance, and Future Scenarios
Technical indicators provide further market insight. The RSI stands at 43.83, and its signal line is 38.06. Both values indicate that bearish momentum still exists. The MACD line is recorded at -2,811.90, with the signal at -2,630.44.
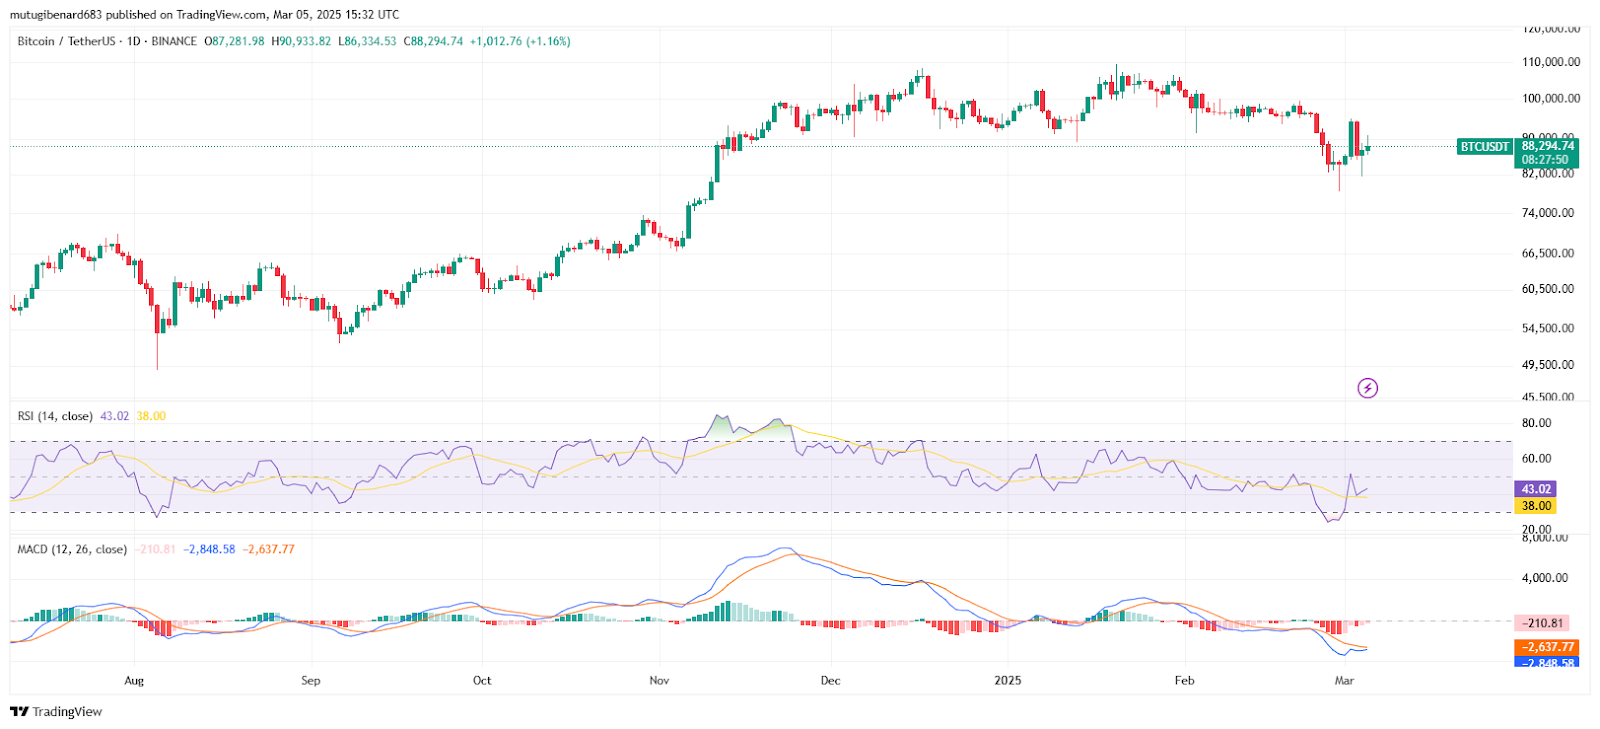
Support levels are placed at $85,000 for the short-term and $80,000 to $82,000 for the major support. The nearest resistance is seen between $90,000 and $92,000. The major resistance lies between $95,000 and $100,000. The price of Bitcoin was sitting at $89,534.67 at the time of writing. The 24-hour gain was 7.89%. The latest trading volume was seen at $63,548,030,269, a 3.18% gain from the last seven days.
Future scenarios depend on the price’s ability to break key resistance. Technical indicators remain central to forecasting market movements. Analysts monitor these levels to anticipate trend changes. These levels remain crucial for market stability during volatile trading sessions.
Overall, Bitcoin’s technical parameters suggest careful monitoring is required. Market participants must watch key support and resistance levels as trading continues. This data remains useful for informed decision-making.