
- Retail Bitcoin inflows reached $10.11B over 30 days, nearly matching June levels despite BTC rising about 27%.
- Whale inflows fell 28% from $6.8B to $4.9B, leaving retail flows about 106% above whale activity.
- Bitcoin traded near $75,730 as weak momentum put $75,000-$75,500 support in focus ahead of the Fed meeting.
Bitcoin traded near $75,730 as retail BTC inflows on Binance reached $10.11 billion over 30 days. CryptoQuant reported Sept. 12 retail flows had returned near June levels, while whale inflows fell to about $4.9 billion. The figures came as markets prepared for the Federal Reserve meeting scheduled for Sept. 15-16.
Retail Flows Return as Whale Activity Falls
According to CryptoQuant, retail inflows were nearly unchanged from June despite Bitcoin rising about 27%. The 30-day retail inflow sum reached $10.11 billion on Sept. 12, versus $10.17 billion on June 6.
Meanwhile, whale inflows dropped from $6.8 billion in June to roughly $4.9 billion on Sept. 14. That represents a decline of about 28%, while Bitcoin traded above $77,000. CryptoQuant said the Sept. 12 retail figure was about 106% higher than the whale reading.
However, exchange inflows alone cannot confirm whether investors are buying or selling Bitcoin. The firm linked retail transfers with profit-taking during price gains. Meanwhile, whales sent less BTC to exchanges during the same period.
Fed Meeting Adds a Major Macro Date
The Federal Reserve meeting began Sept. 15 and runs through Sept. 16. CryptoQuant said markets priced roughly a 90% chance of a 25-basis-point rate hike. That pricing followed the previous week’s inflation data.
Markets can also adjust before an official Fed decision, according to CryptoQuant. Meanwhile, Bitcoin’s recent price action showed a short-term decline from the $79,000-$79,200 area.
The cryptocurrency fell below $76,000 on Sept. 16 before testing the $75,000 area. Price then traded around $75,500-$75,800, with the latest reading at $75,730.08.
Bitcoin Indicators Show Weaker Short-Term Momentum
The one-hour RSI stood at 41.99, above its moving average at 38.97. However, RSI remained below 50 and above the 30 oversold threshold. The MACD line stood at -362.40, while its signal line reached -429.00.
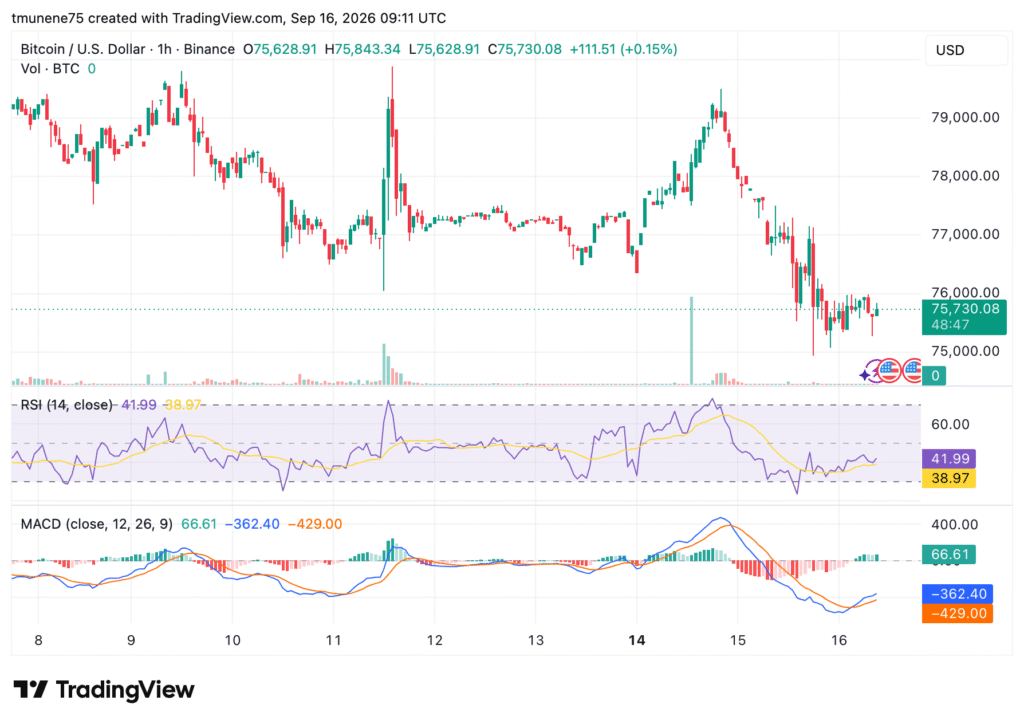
Its histogram was positive at about 66.61, showing weaker bearish momentum. The immediate support area sits between $75,000 and $75,500. A break below $75,000 could expose $74,000 and $73,000, based on the provided analysis. Above resistance, the cited levels were $77,000, $78,000 and $79,000.