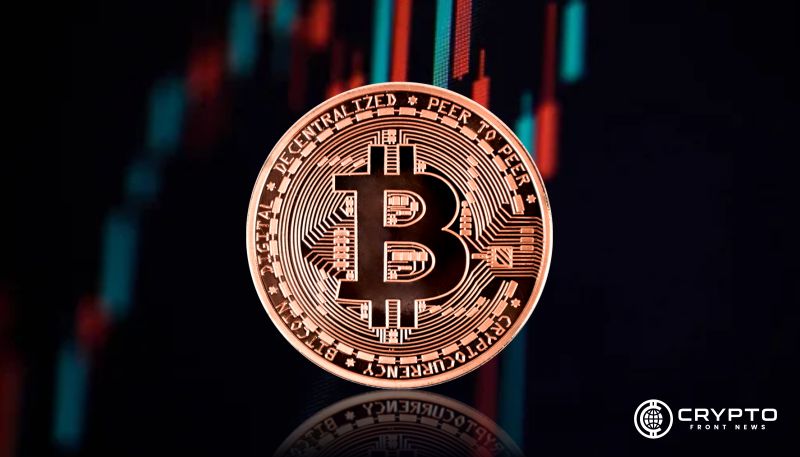
- The price of Bitcoin spiked to $90,788.92, crossing over the top Bollinger Band and affirming robust bullish demand in recent rallies.
- Binance statistics reveal that 59.79% of traders went short, showing bearish sentiment in spite of the ongoing strength in the price performance of Bitcoin.
- Stochastic RSI hovers close to extreme highs, indicating solid buying pressure as bulls test resistance at about $92,620 in continuation of upward drives.
Bitcoin continued to move in an upward thrust with an increase in price by 3.76%, hitting $90,788.92 as of writing and moving above main technical levels. Short positions still dominate on main platforms despite positive price movements, indicating a hesitant market sentiment.
Traders Show Bearish Sentiment Despite Price Rally
According to data from Binance, 59.79% of traders with open Bitcoin positions were short as of April 21 at 10:00. This left only 40.21% holding long positions, resulting in a Long/Short Ratio of 0.67. Such ratios often reflect the prevailing sentiment among retail traders over short time frames.
The 4-hour chart illustrates fluctuating confidence, with short positions climbing after a brief uptick in long activity. The shift suggests a growing expectation for downside price action, even as Bitcoin continues to rally. The dominance of shorts could act as fuel for a short squeeze if upward momentum persists.
BTC Price Breaks Out Above Upper Bollinger Band
Bitcoin’s price surge pushed it above the upper Bollinger Band at $89,744, indicating strong bullish momentum. This breakout comes after reclaiming support at the mid-Bollinger Band (20-day SMA), which now sits at $83,465. The move signals a shift from consolidation to an active uptrend.

Price structure on the daily chart reveals a sequence of higher lows and a bullish candle clearing resistance levels. Buyers appear to be in control, with the next resistance placed at $92,620. A successful breach could send BTC toward the $95,000–$100,000 range.
Momentum Indicators Enter Overbought Territory
The Stochastic RSI readings of 99.84 and 98.29 indicate heavy buying pressure and potential market overheating. Typically, such values precede brief corrections or consolidation, though strong trends can override short-term cooling signals.
Volume will be crucial in the coming sessions. If bullish pressure holds and volume increases, price could extend its advance. On the other hand, rejection at $92,620 may lead to a pullback toward the $86,000–$83,000 zone. Traders remain alert as volatility continues to rise.