
- Bitcoin trades inside a falling wedge pattern, with technical indicators and price action suggesting recovery potential once key support levels firmly hold.
- The Relative Strength Index has risen from oversold levels while MACD narrows its gap, clearly indicating a gradual shift towards bullish momentum.
- The technical analysis identifies support near $81K-$82K and resistance around $94,500-$97,000, setting clear price targets for Bitcoin’s robust, decisive upcoming trend movement overall.
Bitcoin continues trading within a falling wedge pattern on the daily timeframe, suggesting strong recovery potential if the pattern holds. Technical analysis reveals mixed signals from both bullish and bearish trendlines, as well as momentum indicators.
Technical Patterns and Trendlines
A tweet from The Crypto Titan noted that Bitcoin remains inside a falling wedge pattern, indicating recovery chances. The falling wedge pattern usually signals a bullish reversal when support holds. Analysts monitor this pattern closely for market recovery signals. The pattern provides hope for a rebound in the crypto market.
The analysis further presents a descending triangle in the chart. The descending triangle is defined by a declining resistance line and horizontal support, which has been held by buyers. The lower highs along the resistance line in the chart confirm continued pressure to sell. The levels to watch are support of $81,000 to $82,000 and resistance of $94,500 to $97,000.
Price Action and Momentum Indicators
Recent candlestick patterns reveal a sharp drop and a strong bounce from the lower boundary. This movement indicates a temporary relief rally in Bitcoin’s price. The long wicks on candlesticks show considerable buying pressure at support levels. Price action remains volatile as traders react to market fluctuations.
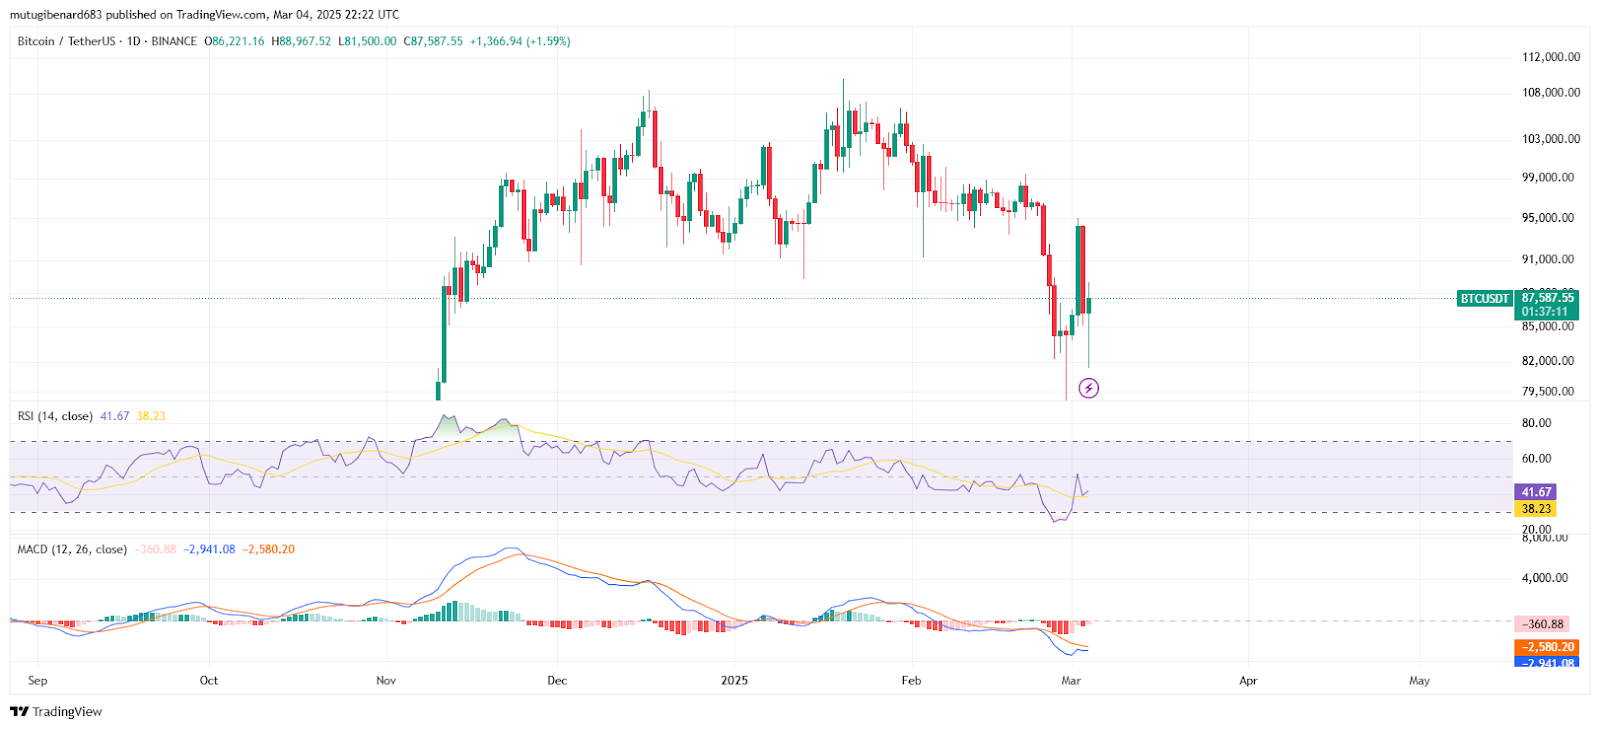
The Relative Strength Index currently reads 42.36, up from 38.28. RSI values below 40 suggest that Bitcoin was recently in oversold territory. The Moving Average Convergence Divergence shows a negative MACD line near -2,573.83. The MACD histogram has narrowed, indicating a possible trend shift if buyers return.
Potential Scenarios and Market Outlook
The bullish scenario can materialize if Bitcoin can surpass the descending triangle resistance. A move from $94,500 to $97,000 can validate a trend reversal. Traders can look to target levels of $100,000 and higher with optimistic expectations. A bullish crossover in the MACD can further validate uptrend momentum.
However, there is a bearish outlook if Bitcoin is not going to find support for nearly $81,500 to $82,000. Breaking below this may take prices from $75,000 to $72,000. Retracement trading is feasible in the short term if support is not held.