
- Javon Marks identifies a bullish MACD divergence as BTC prints lower lows in price but higher lows on momentum indicators.
- MACD lines are converging with RSI stabilizing, suggesting a potential breakout above recent swing highs may follow technical confirmation.
- BTC remains supported by its long-term trendline as accumulation rises, with whales buying dips according to the A/D line.
Bitcoin ($BTC) is showing technical signals of an imminent bullish reversal since its momentum indicators are diverging from its current price action. The setup indicates decreasing downward momentum with declining prices, a signal typically monitored to track the changes in market cycles.

MACD Divergence Suggests Momentum Shift
As noted in a tweet by Javon Marks, this divergence on the chart of Bitcoin may have the price making a strong move up if supported by any further technical signals. The MACD lines are converging right now, which suggests there could be an impending bullish crossover. Such a crossover would terminate the existing downtrend if confirmed with rising volume and a close above the local high.
The current chart on the BTC/USD depicts a classic divergence condition in which the prices make lower lows but the MACD indicator makes higher lows. Such divergence indicates a weakening in the momentum to the downside, which is usually the precursor to a reversal or a bounce.
Support Indicators Signal Strength Behind
On the weekly graph, Bitcoin is still above an enduring ascending trendline that has experienced consistent buying pressure since late 2022. Every price drop to this trendline has witnessed an upside reaction, maintaining the general bullish setup in place.
Stochastic RSI on the weekly chart is in the zone of overselling. The %D and %K lines are both beneath 20 and are set to cross above it soon. This is usually considered a buying signal. The Relative Strength Index (RSI) is steady at 45.89 and indicates neutral momentum with a tendency to recover.
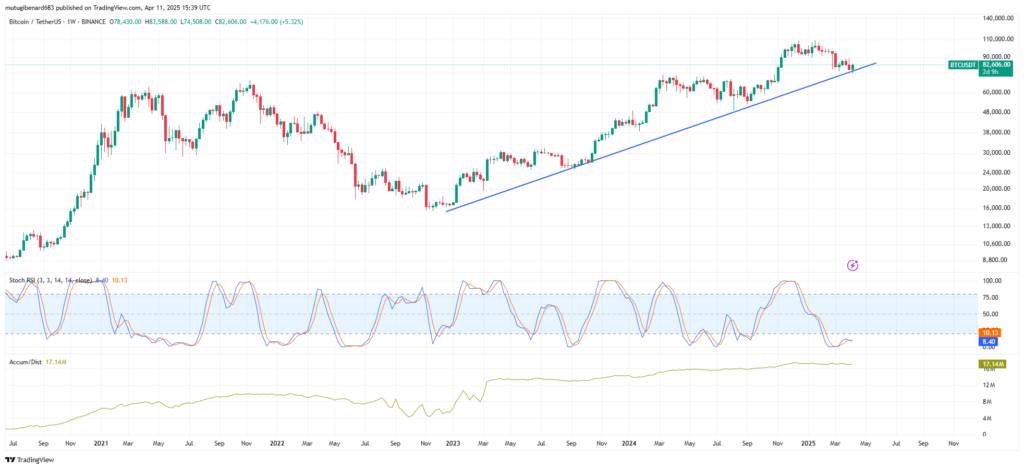
The A/D line is rising, which points to ongoing buying pressure even on the recent corrections. The rising A/D line is evidence to support the argument that larger participants are still on the buy side on declines.
Rebound Level Targets and Market Focus
Bitcoin is trading at $82,542.35 and is up 2.02% in the past 24 hours. If the price breaks above the recent swing high, an upside move to the upper $80,000s becomes technically achievable. Sustained momentum can put Bitcoin in the position to revisit levels above $90,000 based on market affirmation.
Current technical configurations, ranging from the bullish divergence on MACD to oversold Stoch RSI conditions and price stability against trendline support, put BTC into a pivotal technical position.