

- Bitcoin retested its breakout level successfully, following a similar structure observed in Q4 2024 before a strong upward move.
- A bullish flag is forming on the daily chart, with the EMA acting as support for a possible breakout continuation.
- Rising global M2 liquidity aligns with past Bitcoin rallies, strengthening the macro case for continued upward price movement into Q3.
The price of Bitcoin (BTC) continues to remain technically strong after retesting its breakout level and holds its structure, despite recent indecisiveness. Analysts are looking to historical patterns and macro circumstances that may provide insight into a possible bull move into Q3 2025.
Breakout Retest Mirrors Previous Market Behavior
According to market observer Cas Abbé, Bitcoin’s current price structure closely resembles its Q4 2024 breakout. At that time, BTC rallied nearly 50% following a similar pattern. Abbé notes that the current market cap is larger, so such a steep move may not repeat. However, he believes that a rise to $130K–$135K by Q3 remains highly likely.
The breakout and retest are typical market behavior, especially in strong trending periods. A historical reference to similar setups adds validity to the ongoing bullish outlook. There may be some pullback in the short-term, but the overall trend still looks good.
Bullish Flag Structure Forms on the Daily Chart
Crypto Titans has observed a bullish flag pattern forming on the daily timeframe. This classic continuation setup typically follows a sharp upward move, where the price consolidates before resuming the trend. According to the analysis, the exponential moving average (EMA) is currently providing strong support.
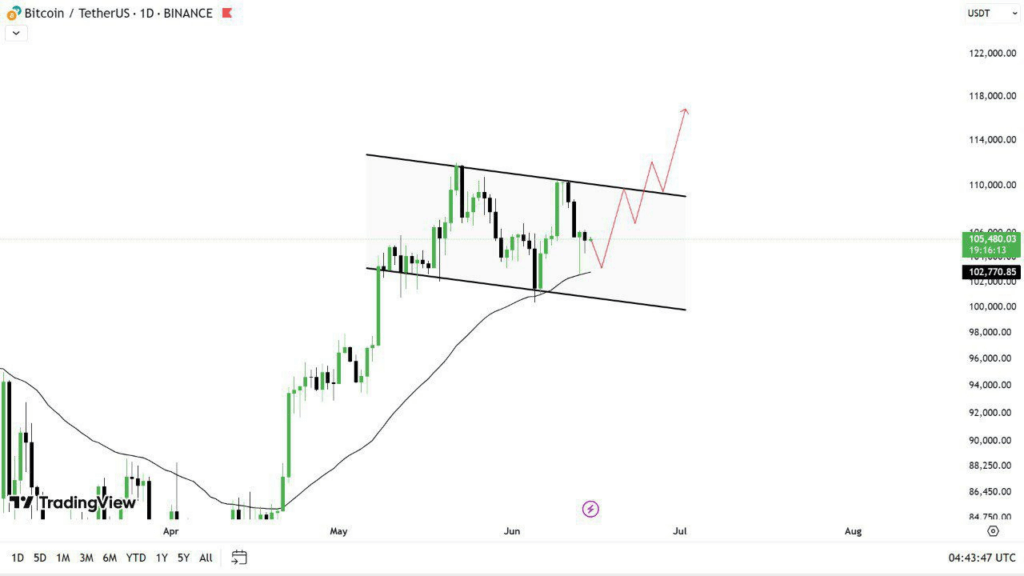
The price action within this flag suggests that buyers are defending key levels. As long as the structure holds, a breakout could develop in the near term. The pattern remains valid while the trend stays intact and EMA support is not breached.
Liquidity Growth Boosts Macro Support for BTC
BitBull, another market analyst, notes that Bitcoin’s price often correlates with global M2 money supply trends. As M2 liquidity rises, BTC tends to follow with upward price movement. Currently, M2 is increasing rapidly, suggesting that a rise in Bitcoin could follow soon.
With a macroeconomic view also reinforcing the technical picture shown in the charts, with rising liquidity always preceding Bitcoin price increases historically, this also offers additional confirmation to the current picture we have identified. Market participants are observing and weighing both technical signals and macro signals to be able to confirm if the next leg higher has indeed occurred.