
- Bitcoin breaks a new ATH of $111K, with market strength supported by historical accumulation patterns and growing investor participation.
- ETF inflows exceed $300M daily, showing strong confidence from institutional and retail investors amid continued upward price momentum.
- Exchange activity and derivatives volume rise significantly, signaling increasing leverage and high profit-driven trading behavior across centralized platforms.
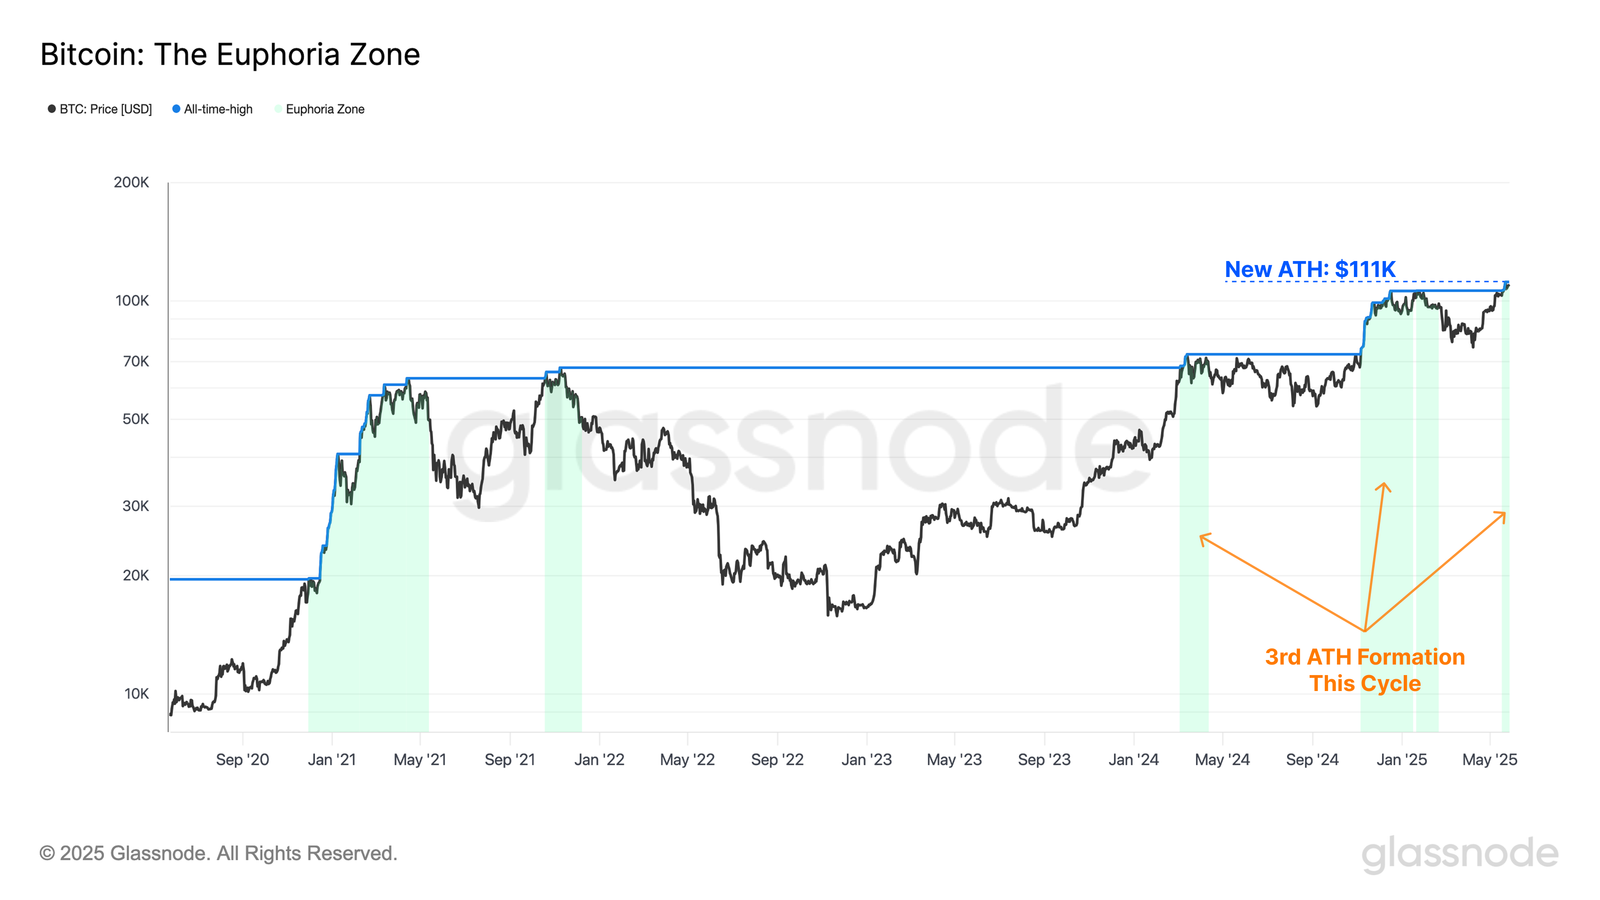
Bitcoin has climbed to an all-time high of $111,000 for the third significant peak in its current cycle. The performance of the asset is still robust, despite macroeconomic and geopolitical conditions continuing to pose issues.
Price Discovery Signals Strength Amidst Volatility
According to the latest Week On-Chain report by Glassnode, Bitcoin has entered another price discovery phase. After peaking at $111K, the market saw a brief retracement to $107K before consolidating at around $108K. Historically, new highs often trigger sell-offs as early investors secure profits. This pattern appears to be repeating, with moderate pullbacks observed post-breakout
Despite its growing market capitalization, Bitcoin’s current cycle is structurally similar to previous ones. Performance since the cycle low shows +656%, compared to +1076% (2015–2018) and +1007% (2018–2022). This suggests ongoing investor demand that matches the asset’s maturity and scale.
Accumulation Trends Reveal Herd Behavior
New all-time highs continue to drive accumulation among various wallet sizes. The Accumulation Trend Score has reached near 1.0 during recent ATHs at $70K and $107K. Glassnode’s analysis indicates strong investor interest during these breakouts, with many opting to increase holdings during these events.
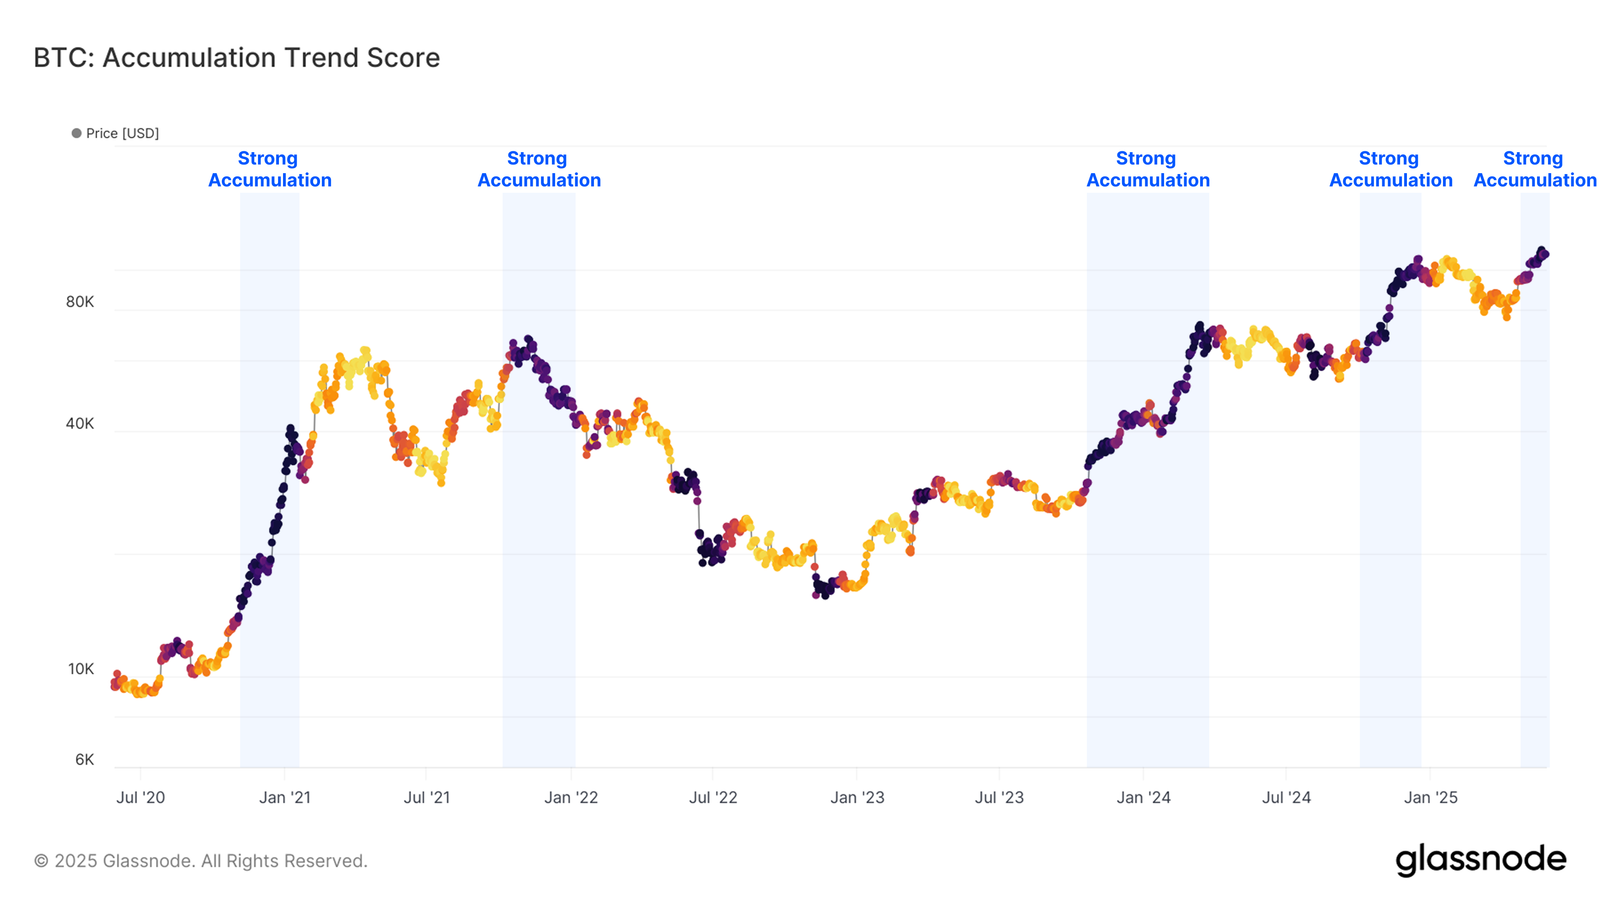
This current trend contrasts with the previous cycle’s $69K high in November 2021, which saw accumulation extend beyond the peak. While strong accumulation is often perceived as a bullish indicator, Glassnode notes that collective investor behavior around ATHs can also lead to misaligned expectations if it becomes too uniform.
Profit-Taking Activity Intensifies
As Bitcoin returns to price discovery, unrealized profits are rising sharply. The Relative Unrealized Profit metric has moved above its +2σ band. Historically, such levels are associated with euphoric markets and increased volatility. These phases tend to be short-lived, occurring during just 16% of trading days.
Profit realization is now accelerating. The Volatility-Adjusted Net Realized Profit/Loss shows a notable increase in realized gains as the price surpasses previous ATHs. SOPR, which measures on-chain profit multiples, shows that average profits per coin now stand at +16%. Only 8% of trading days have recorded higher profitability.
Centralized Exchange Volumes See Uptrend
Bitcoin exchange activity is also on the rise. Since the $109K ATH earlier in the year, Glassnode reports that 33% of on-chain volume is now interacting with centralized exchanges. This rising Exchange Volume Dominance signals growing investor participation in active trading.
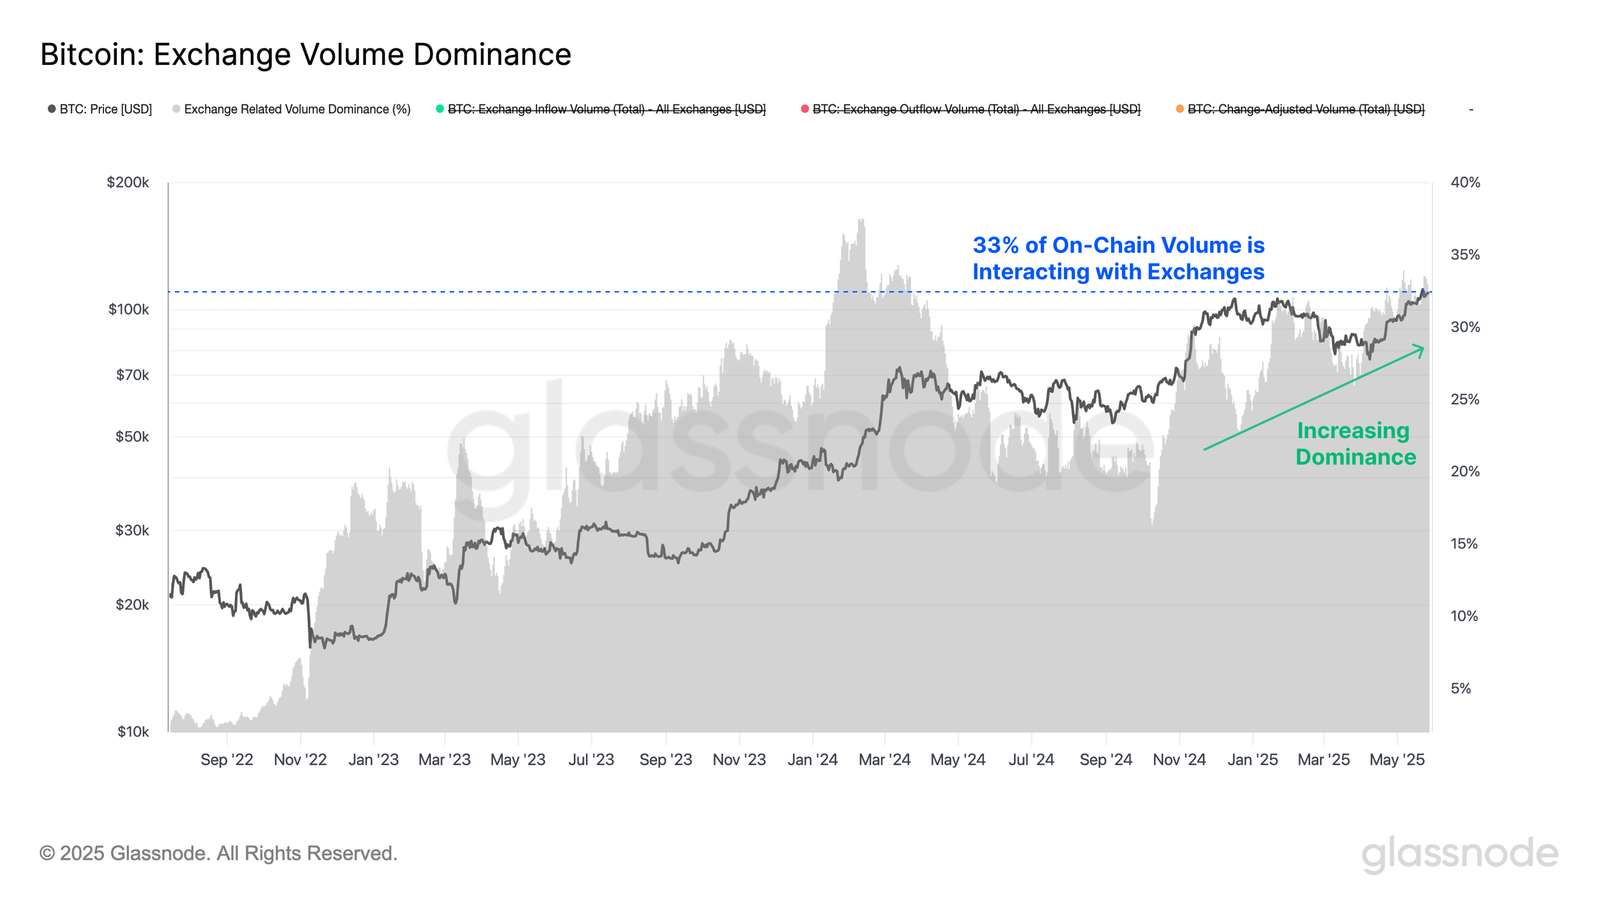
Further insight into exchange behavior shows a pronounced profit-driven trend. Currently, coins moved to exchanges are realizing an average profit of $9.3K, while coins moved at a loss average just -$780. The ratio between profits and losses is near historical extremes, indicating intensified trading during the current bull market stage.
Derivatives Markets Show Rising Leverage
Derivatives markets are experiencing renewed growth. Futures open interest has climbed from $36.8B in April to $55.6B, reflecting a 51% increase over 49 days. Options open interest has grown even more sharply, rising from $20.4B to a record $46.2B during the same period.
Glassnode attributes the rise in options activity to a maturing investor base. Market participants are increasingly using options to implement sophisticated risk strategies. The growing use of derivatives coincides with increased exchange activity and supports the view that traders are leveraging bullish sentiment.
ETFs Maintain Consistent Inflows
Bitcoin spot ETFs continue to attract strong inflows. Since late April, these products have consistently received over $300 million per day. This sustained buying pressure from both institutional and retail investors adds considerable support to Bitcoin’s upward momentum.
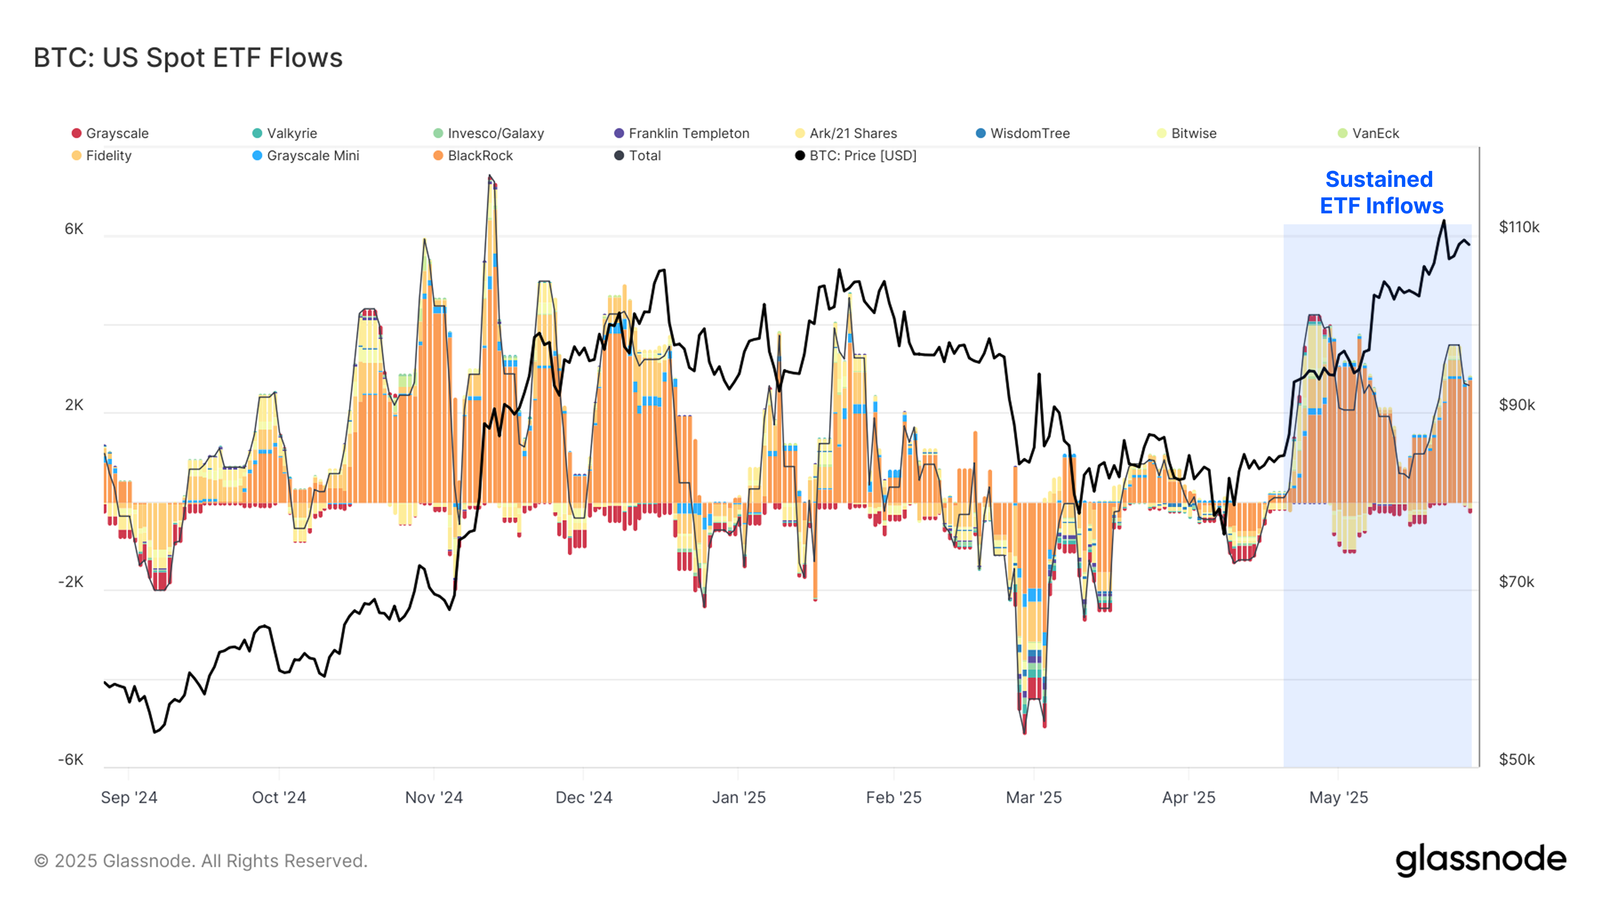
ETF inflows have contributed to the recent series of ATHs and are now regarded as a key source of market stability. The consistency of these inflows points to an ongoing confidence in the asset from a wide range of investors.
On-Chain and Technical Levels Define Market Outlook
Glassnode provides key support levels using both technical and on-chain indicators. The 111DMA, 200DMA, and Short-Term Holder (STH) cost basis stand at $91.8K, $94.3K, and $95.9K respectively. Bitcoin’s current price remains well above all three levels, indicating robust market strength.
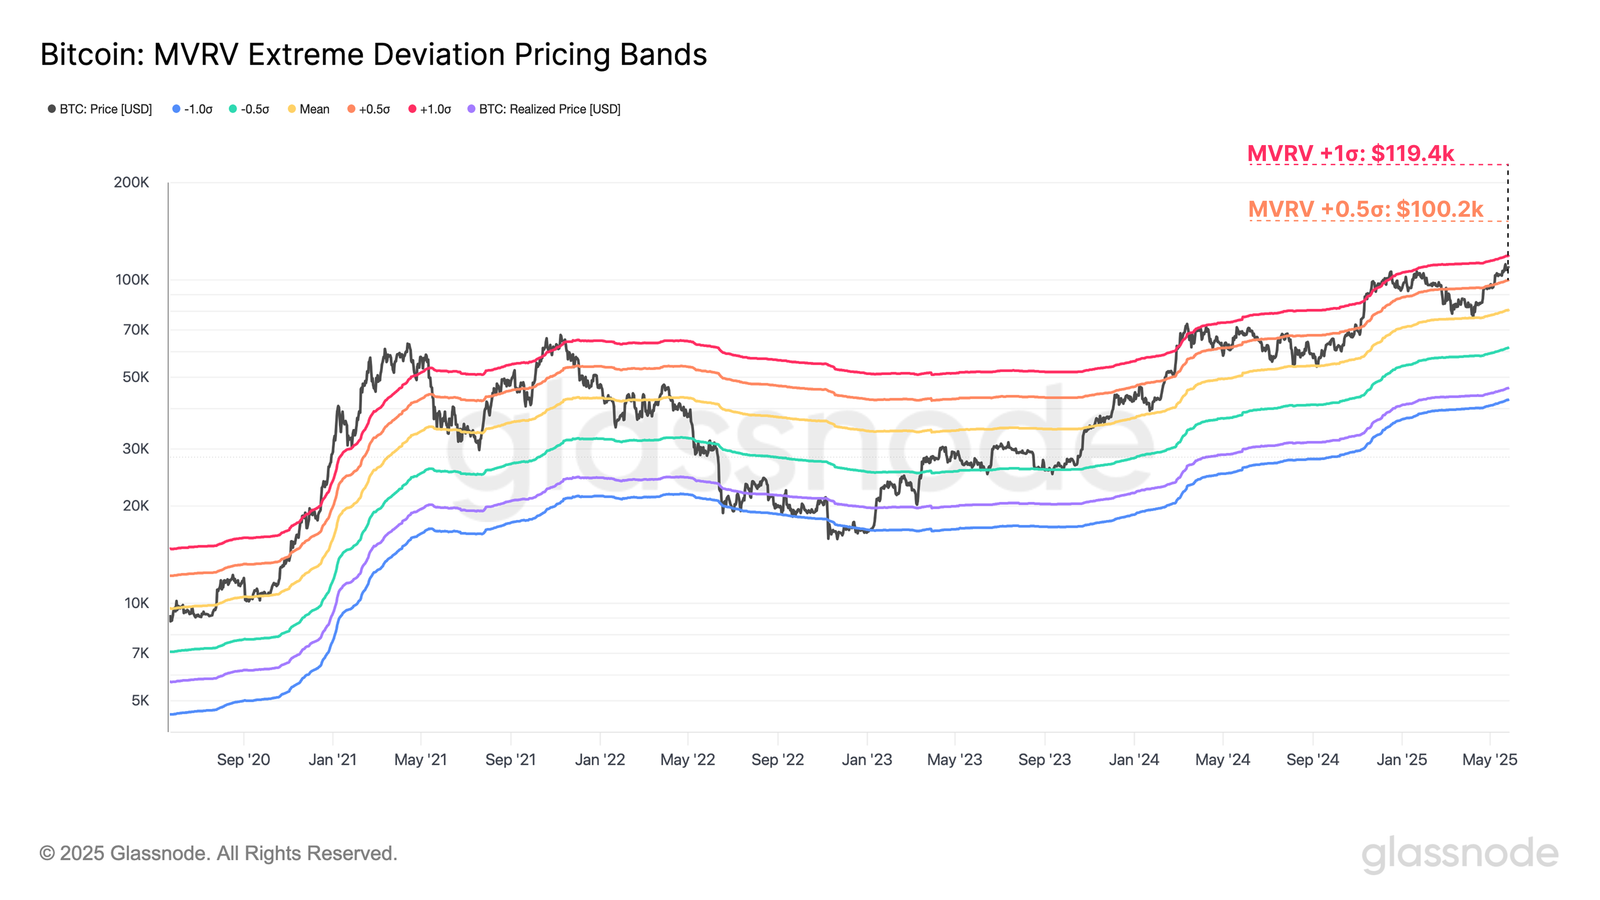
Using the MVRV Ratio, Glassnode places Bitcoin’s Realized Price +0.5σ at $100.2K and +1σ at $119.4K. The asset is currently consolidating between these levels. Historically, price movements into this range indicate elevated investor profitability but have room for continued upward movement before extreme levels are reached.
Additionally, the STH-CB +0.5σ and +1σ bands are at $120.3K and $135.7K, respectively. These levels have previously signaled local topping zones. Bitcoin has traded in this upper band for only 17.5% of its history, making its entry into this range a notable event for market watchers.