
- CryptoQuant identifies major Bitcoin resistance zones between $88K and $111K from underwater investor cohorts.
- Analysts say BTC must reclaim and hold above $88,880 to confirm a broader market bottom recovery.
- Recovery strengthens above key averages, but death cross and sell pressure still threaten upward momentum.
Bitcoin traders calling a market bottom may be moving too early, according to CryptoQuant data. BTC traded near $81,400 after rebounding from February lows around $62,000, however analysts said the recovery still faces strong resistance from underwater holders between $88,000 and $111,000.
CryptoQuant Highlights Key Resistance Zones
According to CryptoQuant, three major realized price levels now sit above Bitcoin’s current market price. The first resistance stands near $88,880 from holders who bought between three and six months ago.
Another resistance cluster sits near $93,450 from the 12-month to 18-month cohort. Meanwhile, the largest realized price band remains near $111,850 from buyers who entered between six and 12 months ago.
CryptoQuant said those levels represent break-even exit points for investors trapped during Bitcoin’s late 2025 correction. The firm added that reclaiming $88,880 remains necessary before confirming a broader market bottom.
According to the data, BTC must hold above that level instead of briefly trading through it. That move would place the most recent cohort back into profit and reduce immediate sell pressure.

February Capitulation Still Shapes Market
Bitcoin entered a sharp correction during November 2025 after trading above $100,000. Selling pressure accelerated into early February 2026 as BTC dropped toward the $62,000 support zone.
Notably, buyers quickly returned after the capitulation decline, helping BTC recover steadily through March and April. The market then formed higher lows and higher highs during the rebound phase.
At the same time, Bitcoin reclaimed its 50-day moving average near $78,900. The asset also continued trading above the psychologically important $80,000 level.
However, the 50-day moving average crossed below the 200-day average during February, forming a bearish death cross. Analysts often associate that pattern with medium-term downside momentum.
Bitcoin Recovery Faces Another Test
The 200-day moving average near $75,300 currently acts as long-term support for Bitcoin’s structure. According to the chart data, sustained trading above both moving averages may strengthen recovery momentum.
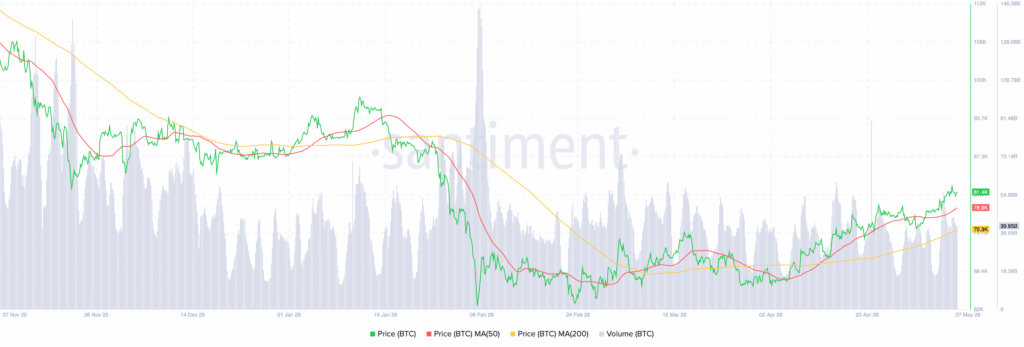
Rallies between $85,000 and $88,000 still face distribution pressure from buyers seeking break-even exits. Volume increased moderately during the latest recovery phase, showing stronger market participation than previous rebounds.