
- According to Arthur Hayes, Bitcoin will probably reach a bottom at about $70K, yet market performance could extend to $1 million over the long term.
- The February technical analysis indicates bearish trends after both the 9-day EMA and 21-day EMA crossed each other negatively through MACD signals.
- The market value of Bitcoin has reached $80,397 with reduced trading activity as it moves to check vital support points from $76K up to $80K while encountering possible resistance at $85K to $88K.
The attention of traders focuses on Bitcoin market movements because they want to detect potential price reversals during negative market indicators. Bitcoin market analysts now predict the digital currency will find its lowest point at $70,000, which has sparked extensive expert evaluation on market trends and technical indicators.
Market Predictions
A tweet from Wu Blockchain presented Arthur Hayes’ view on Bitcoin’s potential price correction. Hayes stated that Bitcoin may bottom near $70,000, representing a 36% decline from its $110,000 high. He projected Bitcoin to reach $250,000 by year-end and $1 million in the long term.
Another tweet by Hayes advised patience in trading. He explained that traditional stocks, such as $SPX and $NDX, are expected to decline. Hayes also noted that central banks may ease policy after market corrections. Traders may consider buying the dip or wait for easing before deploying capital.
Technical Analysis Overview
A technical chart shows a trend-following view with short-term momentum overlays. Two moving averages, the 9-day EMA and 21-day EMA, indicate trend direction and potential reversals. The 9-day EMA reacts quickly to recent price changes, while the 21-day EMA smooths short-term noise. A bearish crossover occurred in late February when the 9-day EMA fell below the 21-day EMA.
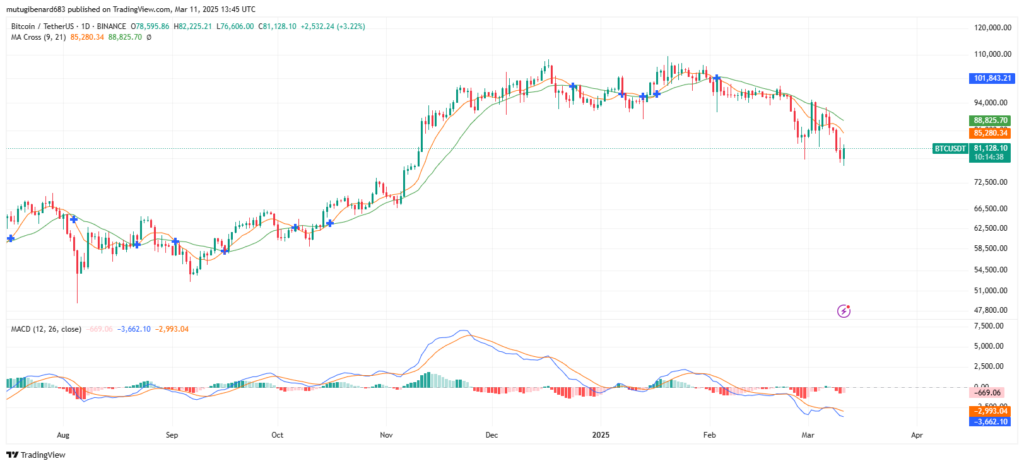
The MACD analysis presents negative momentum. The MACD line is -3,725.87, and the signal line is -3,005.65. The MACD histogram remains at -720.22, indicating persistent bearish momentum. Histogram bars contract slightly, suggesting a reduction in momentum.
Earlier bullish crossovers in November captured the rally that pushed prices above $110,000. Analysts note that these events contrast with the recent bearish crossover observed in February. The technical indicators remain consistent with the current downtrend and reflect price weakness.
Price Action and Support Levels
As this article is written, Bitcoin holds a market value of $80,397.19 while processing $60,654,144,656 worth of transactions throughout the day. The price dropped 2.37% on the day and decreased 4.52% throughout the past week. The asset remains below both EMAs, which continue to slope downward. Bitcoin is testing support near the $76,000 to $80,000 zone, a level that served as resistance during a Q4 rally.
Immediate support is identified at $76,000, while resistance ranges between $85,000 and $88,000. A close above $82,000 could signal short-term recovery. A break below $76,000 may lead to further decline and test the $70,000 level. These levels are critical for future price action.
Market participants exhibit increasing worry about a potential economic contraction within the United States. Market activity has suffered effects because of rising inflation alongside increased interest rates as well as geopolitical tensions. The proposal of reciprocal tariffs by President Donald Trump increased market uncertainty. These elements produced a major market reduction across the board. Analysts monitor such developments alongside technical indicators.