
- Bitcoin is forming a declining wedge pattern, with resistance points of $100K and targets of $110K and $120K.
- Market indicators, including MACD and RSI, are suggesting consolidation, with a volume-driven breakout and on the lookout for bull signals.
- A bearish breakdown of $93K may take Bitcoin down towards $85K–$87K, and holding on may result in a steep upswing.
Bitcoin remains in a critical position, trading within a defined declining wedge pattern. The overall trading atmosphere has been very stagnant, and this has led to a period of time-based capitulation. Previous trends, however, suggest such trends are generally related to a big upward movement, and this has led to optimism from traders and experts.
Falling Wedge and Key Resistance Levels
Crypto analyst @el_crypto_prof also pinpointed Bitcoin’s current falling wedge pattern, a classic reversal pattern. The price has been setting lower lows and lower highs, with key support between $93,000 and $94,000. The resistance on top of this is $100,000, and a breakdown of this point may be the harbinger for a firm bullish momentum. Volume has been on the decrease, indicative of decreasing selling momentum and a probable movement towards an upward breakout.
Multiple touches on the support trendline suggest firm demand on lower levels, highlighting the likelihood of a pending movement. If Bitcoin penetrates the resistance zone, the target range may be $110,000 and $120,000.
Market Indicators and Momentum Analysis
Current indicators are giving mixed signals. The Moving Average Convergence Divergence (MACD) remains bearish, with the MACD line remaining below the signal line, showing sustained selling. But histogram bars are stabilizing, and there may be a reversal of momentum. A bullish crossover could signal the beginning of a new upswing.
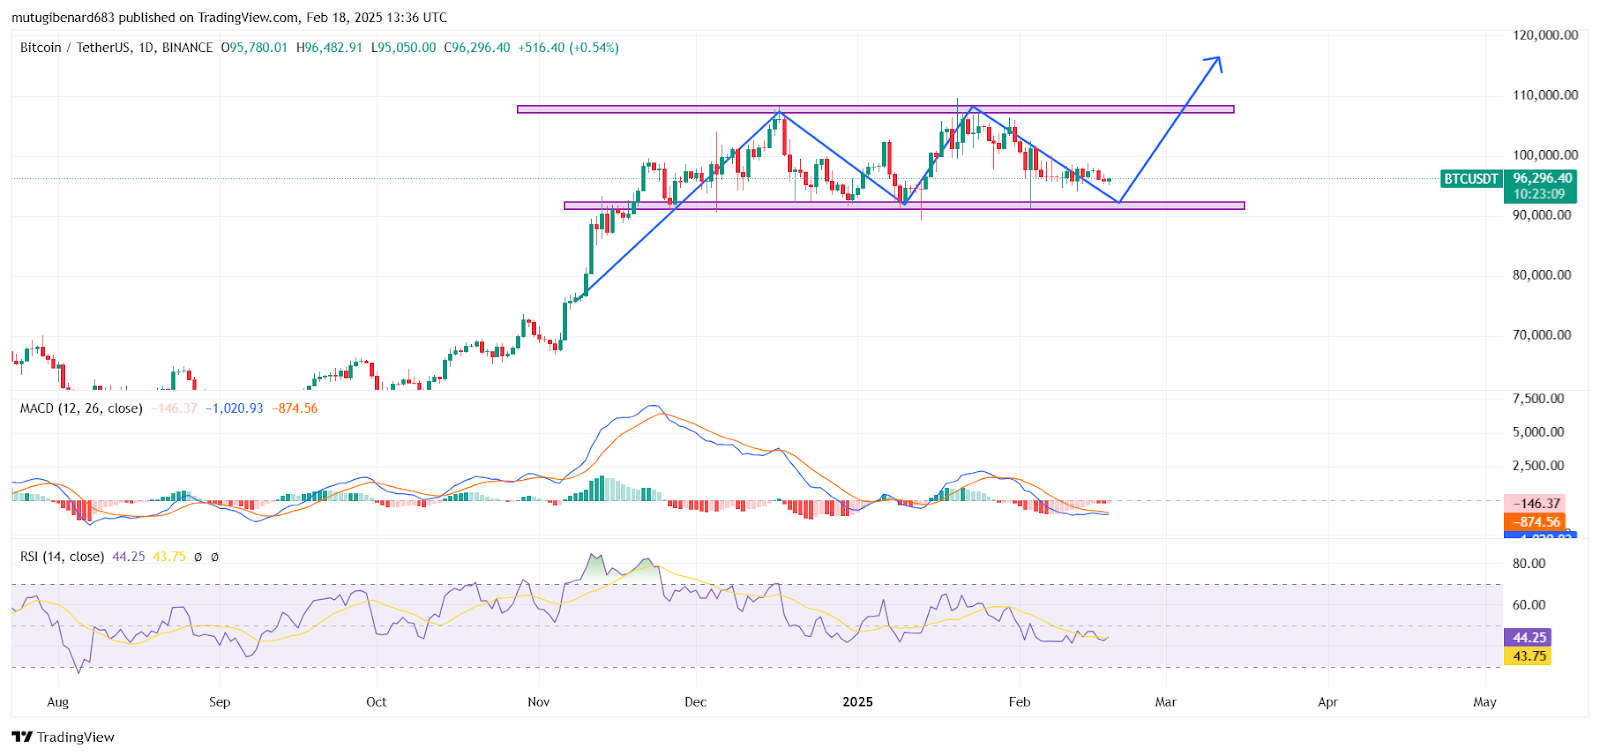
The Relative Strength Index (RSI) of 43.91, being very near the 50 point of neutrality, suggests Bitcoin still stays in consolidation, with buying and selling not dominating the markets. A breakout higher than 50 would be confirmation of renewed bull momentum.
Potential Scenarios: Bullish or Bearish
A bullish breakout still looks the most probable. If Bitcoin can maintain its levels above $93,000–$94,000 and can surpass $100,000, a jump towards $110,000 and higher may be on the cards. Buyers will be looking for confirmation in the form of higher volume and a supportive movement of indicators.
On the downside, if Bitcoin slides under $93,000, more drops towards $85,000–$87,000 can be expected before stabilizing. A drop under $90,000 will signal a larger bearish trend, with lower levels of supports around $80,000.
With Bitcoin sitting at $95,863.46 at the time of writing, lower compared to the last week, traders are on their heels. With the asset still trading in its range, everyone’s eyes are on significant resistance levels and technical indicators for what the next significant movement of Bitcoin’s journey will be.