
- Bitcoin ETFs record $1.46B in five-day inflows, highlighting persistent institutional demand despite recent market volatility.
- Ethereum loses ground against Bitcoin as ETH/BTC forms a descending triangle, pointing to possible further downside if support breaks.
- ETF flow patterns reveal growing institutional trust in Bitcoin, with strong accumulation despite price corrections and market swings.
Per Santiment data, Bitcoin ETFs have raked in over $1.464 billion in net inflows over these past five trading days. This surge in interest from institutional investors comes as Bitcoin has briefly dipped below $104,000 on Tuesday. Here, five days of buying strength are recorded with the prevailing lack of clarity in the markets. In spite of short-term price fluctuation, institutional investors are making away with greater allocations into spot Bitcoin ETFs. This trend further establishes confidence in Bitcoin’s long-term attractiveness as an issue of mainstream investment.
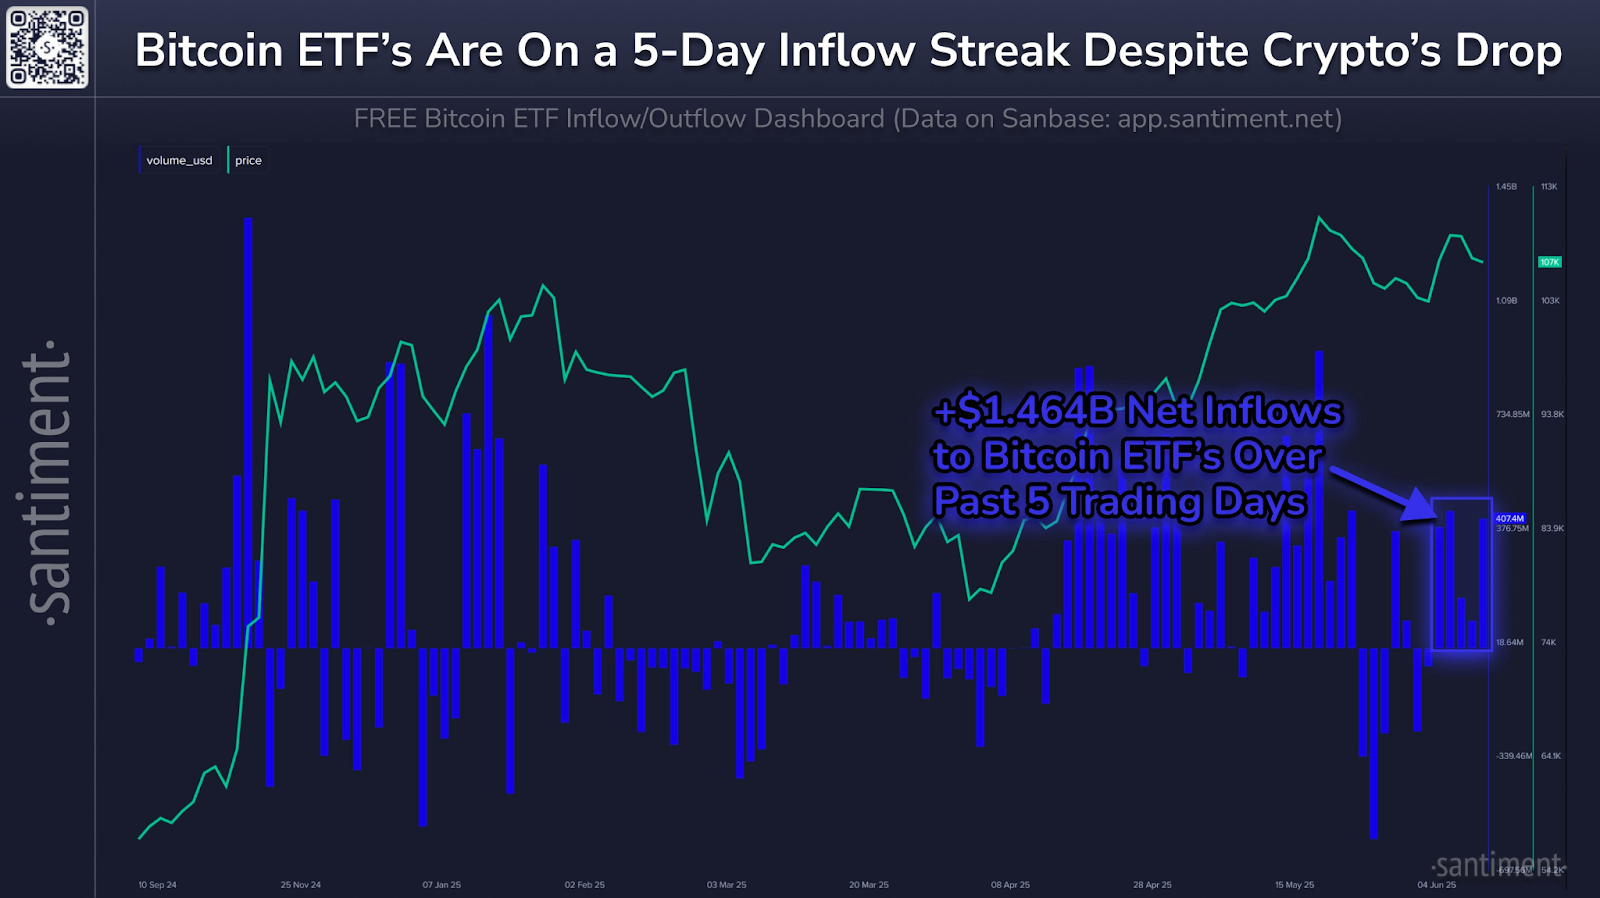
Source: Santiment
Moreover, Santiment’s analytics show these inflows defy typical market behavior. Usually, declining prices weaken institutional appetite. However, Bitcoin’s recent correction failed to slow ETF demand. Hence, the steady accumulation signals sustained interest despite short-term dips. The ETF dashboard reveals that the largest single-day inflow occurred in November 2024, topping $734.85 million. That spike coincided with Bitcoin’s surge toward new all-time highs.
Additionally, ETF activity from December 2024 to February 2025 displayed alternating inflows and outflows. This pattern aligned with price consolidation phases. Markets absorbed previous gains, and institutions recalibrated strategies. Then, March 2025 brought renewed demand, as institutional flows accelerated again. The strongest outflow event occurred in early 2025, reaching $329.40 million. However, Bitcoin’s price quickly rebounded, showing underlying bullish strength.
ETH/BTC Pair Sees Sustained Decline
Meanwhile, Ethereum continues underperforming Bitcoin in the ETH/BTC pair. The pair trades at 0.02398 on Binance, down 0.08% today. Since peaking at 0.03200 in March 2025, ETH/BTC has dropped around 25%. April’s chart displays consecutive red candles as sellers maintained pressure. Moreover, the pair forms a descending triangle pattern on the daily chart, signaling a potential breakdown.
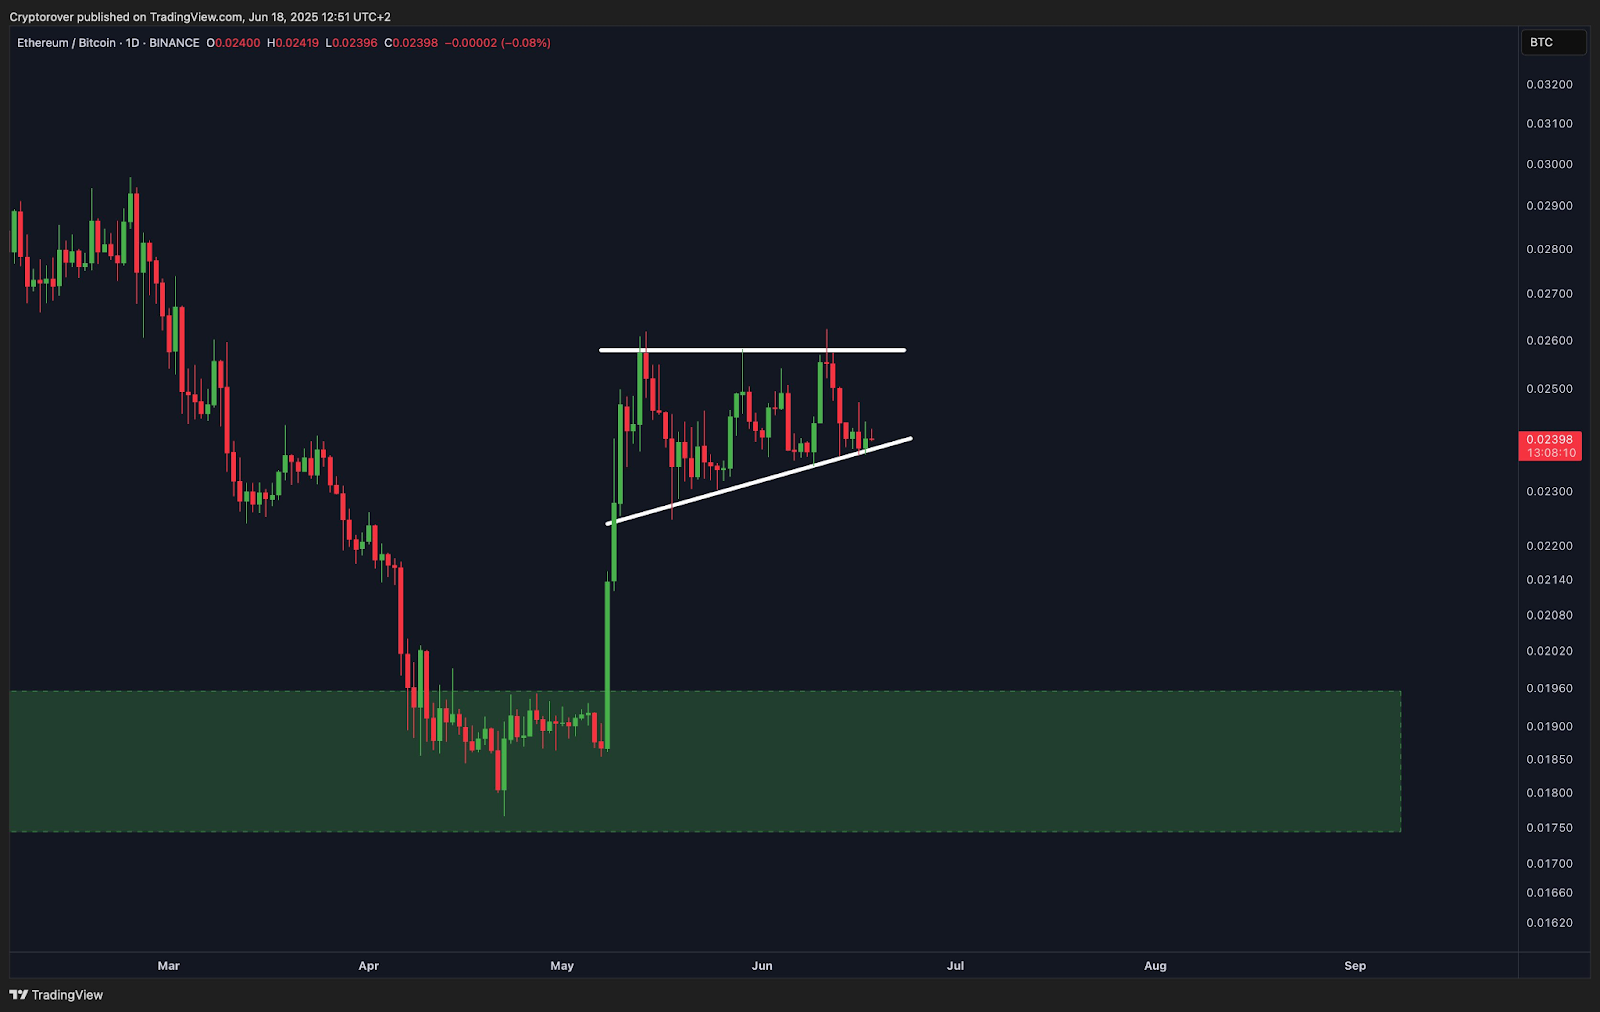
Source: Crypto Rover
The triangle pattern’s upper resistance line descends from March highs. A solid support zone remains around 0.01900, marking a critical level. Price has repeatedly tested this base through May and June without breaking lower. However, ETH/BTC now nears the triangle’s apex. Consequently, a breakout could soon occur.
Volume patterns suggest weakening buyer strength. Each attempt to break above resistance failed. If price breaches 0.01900, deeper declines may follow. Traders watch closely for confirmation of the triangle’s resolution. Ethereum must regain momentum or risk further relative weakness.