
- Bitcoin has crossed major support at the price of $91,758, confirming a bearish head and shoulders reversal with the lower price targets of $84,000-$80,000.
- The 20-day EMA at $96,032 remains a vital resistance zone, affirming the bearish trajectory of BTC with selling remaining the dominant force in the market.
- If Bitcoin does not recapture $92,500 in the near future, the buyers might experience further losses with the next vital support zones at $88,000 and $84,000.
Bitcoin (BTC) maintains an active downtrend condition with prices now remaining under crucial support points. The market price for BTC stood at $89,199.27 at the time of writing while experiencing 6.82% daily and 6.79% weekly drops. The market sentiment is bearish as it comes under more selling pressure.
Breakdown Below Parallel Channel Signals Further Decline
Cryptocurrency analyst Ali explained that Bitcoin has crossed a parallel channel and the probability of a dip toward $81,000 unless the price recovers immediately at the price of $92,500 has increased. The breakdown follows a series of lower highs and lower lows that identify a bearish trend after BTC reached an all-time price higher than $104,000.
Levels of support and resistance are increasingly defining BTC’s direction of travel. BTC’s price at the moment is stuck at around $88,000 and that might be temporary support. Yet if the bearish trend continues, the next major area of support will be between $84,000 and $80,000. The upside has the immediate resistance at $92,000 with a stronger psychological line at between $96,000 and $100,000. Regaining the latter will be vital if any reversal of fortunes is to be expected.
Head and Shoulders Pattern Suggesting Bearish Mood
Technical analysis exhibits a head and shoulders (H&S) formation, a bear reversal pattern that has been confirmed with the breach of the neckline at a price of about $91,758. The 20-day Exponential Moving Average at $96,032 also reaffirms the bearish tone with BTC trading below this critical mark. Resistance at $109,357 remains firm and coincides with the top of the H&S formation.
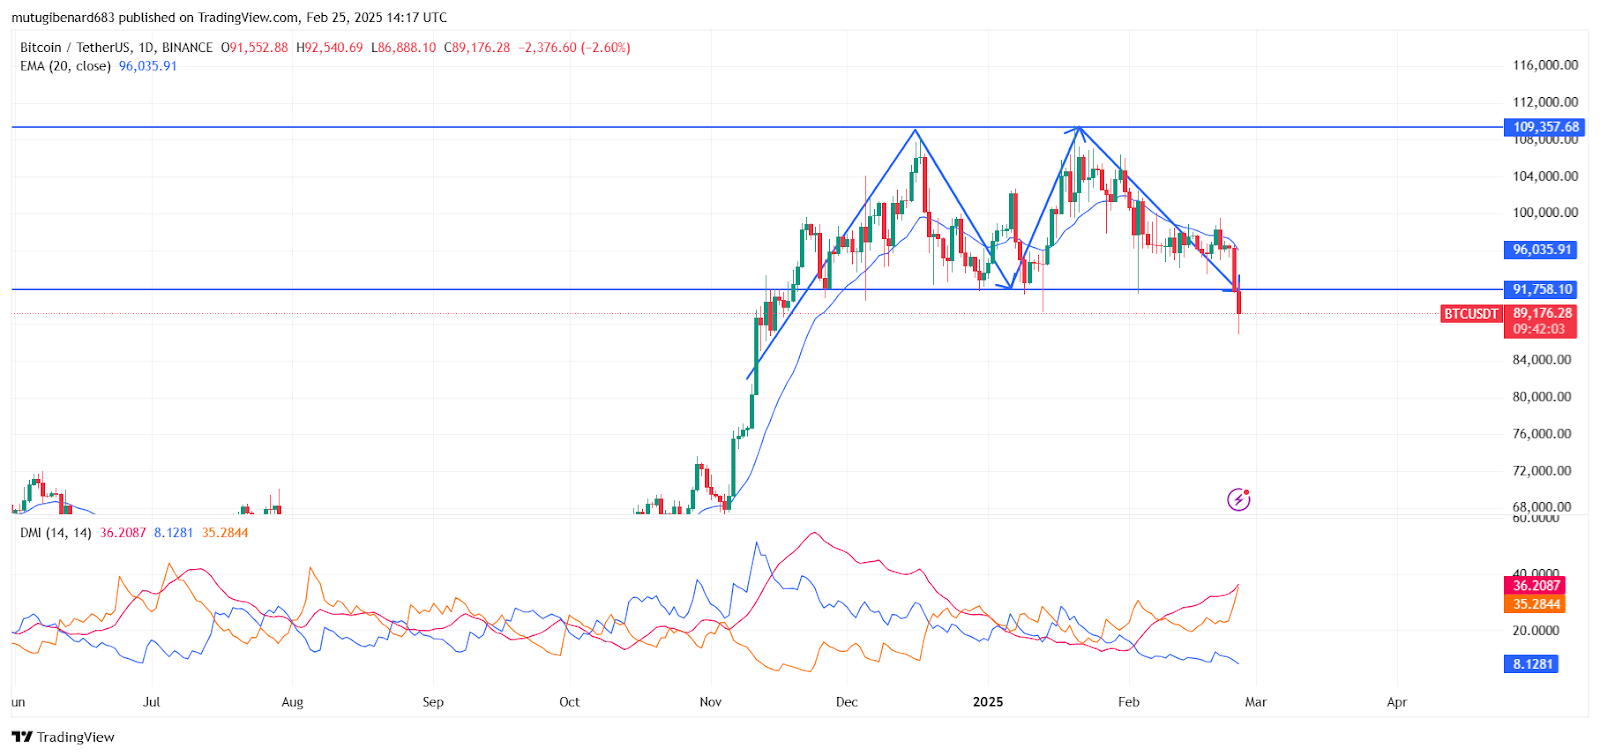
Directional Movement Index (DMI) also leans toward the bear side with the red line (DI+) still higher than the orange line (DI-), signaling stronger selling pressure. The low blue ADX of 8.12 also tells us that the trend has been weakening, but bearish momentum has begun to build once more.
Possible Market Scenarios and Future Outlook
BTC needs to cross $91,758 to avoid a potential market drop that might reach the prices between $84,000 to $80,000 which matches the bearish pattern collapse scenario. When BTC rises above $92,000 while closing above $96,000 it indicates the potential to reach the price range of $100,000–$109,000.. However, this scenario requires substantial buying volume and bullish momentum, which currently appears weak.
With BTC losing the major support and confirming a head and shoulders top, investors should be cautious. Short of Bitcoin reclaiming $91,758 at once, the path toward the direction of $84,000-$80,000 becomes the highest probability scenario.