
- Ali’s tweet notes that every bullish crossover on the Stochastic RSI has triggered Bitcoin rebounds, encouraging traders to watch for reversal signals.
- Technical analysis shows Bitcoin in a corrective phase, with strong support between $75K and $80K acting as a pivot for upward movement.
- The 14-day RSI and DMI readings indicate neutral momentum and moderate trend strength, with vigilant traders watching for a stochastic crossover confirmation.
Bitcoin is in a period of correction as technical indicators have indicated a possible reversal to the upside. Traders wait closely for confirmation from momentum oscillators as they observe key levels in this period of consolidation.
ali_charts explains that all bullish crossovers of the stochastic RSI have led to a notable Bitcoin bounce over the past three years. A potential crossover could potentially signal a bullish reversal.
Price Correction and Support Levels
Bitcoin reached an all-time high of over $100,000 before it entered a correction period. The price subsequently retraced with a series of lower highs in recent trading sessions. Traders now look to the correction period as the asset consolidates.
The market currently demonstrates support barriers spanning from $75,000 to $80,000.The active resistance area falls within $90,000 to $92,000 which highlights their critical nature. These levels remain crucial to short-term market direction.
Stochastic RSI and Momentum Analysis
Stochastic RSI dropped below the level of 20, which places it in oversold levels. These oversold conditions have historically resulted in price bounces in the past cycles. The indicator is also viewed by traders as a good momentum indicator.
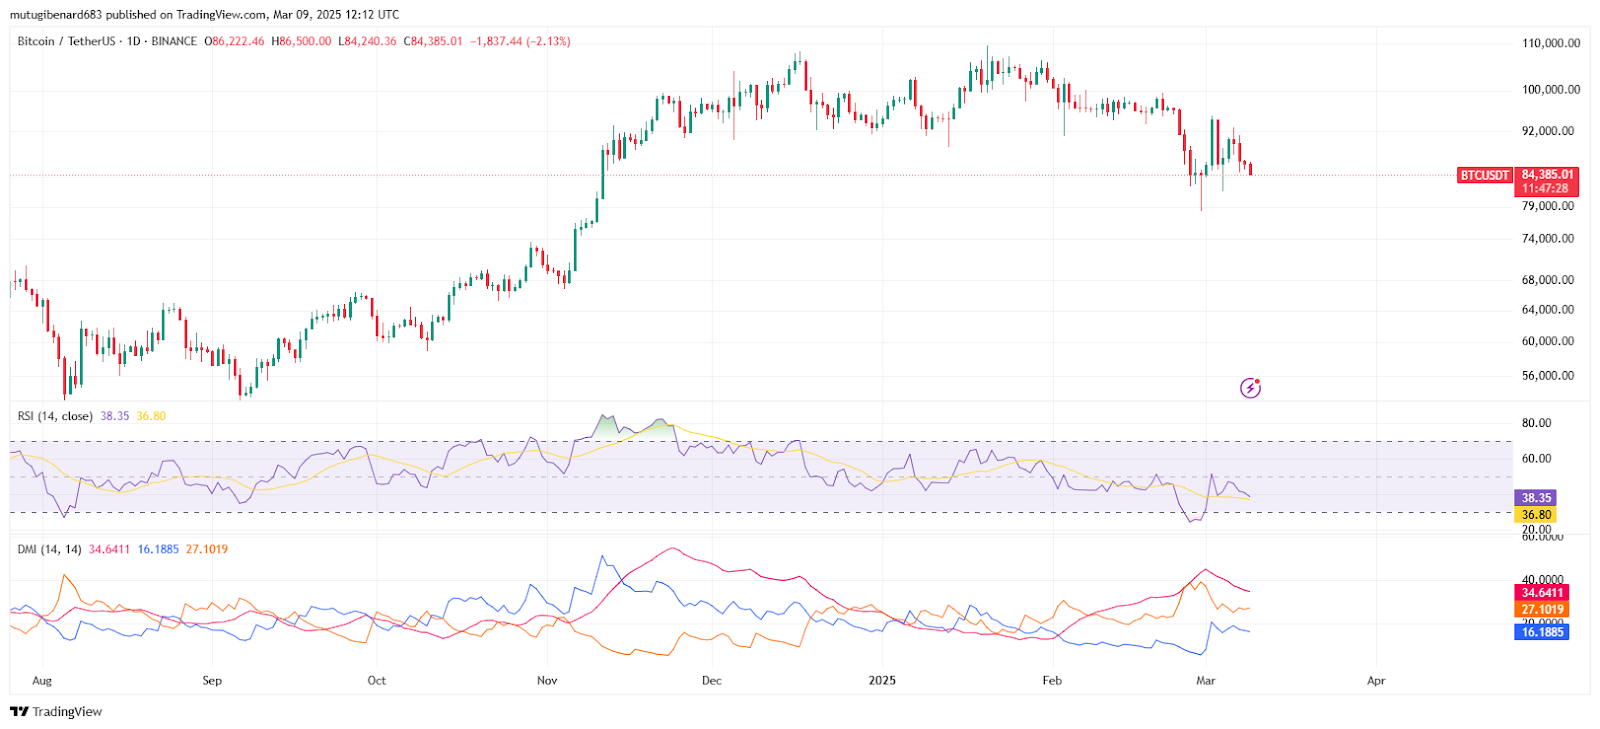
The 14-day Relative Strength Index stands at 38.88 with an average of 36.84. Both of these readings show weakness and a crossover to the positive side could signal new strength. Market participants watch these oscillators for potential trend reversals.
Possible Scenarios
A bullish trend is possible if Bitcoin remains supported above the $80,000 level. If this occurs, the price will increase to the $90,000 to $92,000 range as the momentum builds. Technicals support this opportunity since the stochastic crossover is a sign of a reversal. Alternatively, a drop below $80,000 could result in more losses to $75,000.
The Directional Movement Index and the ADX, with values of 34.55, 16.31, and 26.56, indicate a moderate trend. When this article was written Bitcoin maintained a price of $84,957.19 while trading $15,134,691,411 throughout one day. Ali’s tweet places the potential stochastic crossover as a key indicator, putting it in the spotlight of future movements.