
- Bitcoin lost long-term channel support, keeping downside pressure active toward key lower demand levels.
- The market was down during the rebounds and the recovery force was not strong enough to compensate for that.
- Sentiment indicators remain subdued, suggesting buyers have yet to regain firm market control.
Bitcoin Bear Market conditions have been top of mind as traders watch for diminishing market structure. Recent price action has kept downside targets relevant while sentiment indicators continue showing limited buyer conviction.
Failed Support Levels Keep Downtrend Intact
Alpha Crypto Signal revisited a bearish roadmap shared months earlier. The market commentary identified support zones near $78,000 and $70,000. Both levels eventually failed during the ongoing correction.
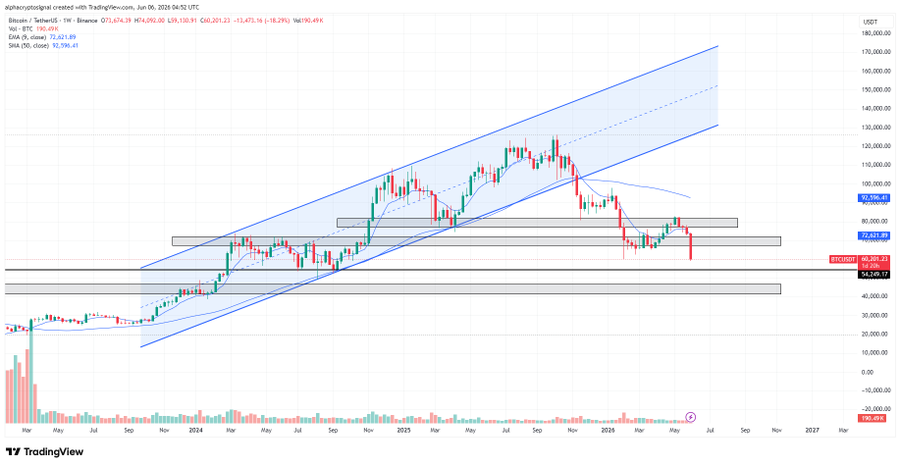
This analysis focuses on Bitcoin breaking out of a long-term ascending channel. It was that structure that supported price advances during much of 2024 and into 2025. Multiple successful tests previously reinforced the channel’s importance.
Once channel support failed, market behavior changed noticeably. Higher highs and higher lows disappeared from the chart. Lower highs then emerged as sellers regained control.
The report noted a failed retest after the breakdown. Former support quickly turned into resistance during subsequent rallies. Technical analysts often view that pattern as bearish confirmation.
Bitcoin Faces Critical Test Near Lower Demand Zone
Bitcoin is, as of writing, trading near the $60,000 region, according to coinmarket cap data. Recent recovery attempts struggled beneath established resistance areas. Buyers failed to generate sustained upward momentum.
The analysis identifies approximately $54,000 as the next major support. This area now represents an important battleground for market participants. Traders continue monitoring whether demand can stabilize prices.
Should that zone fail, attention shifts toward $45,000 support. The projected target was outlined as a potential capitulation region. Alpha Crypto Signal described it as a worst-case scenario.

The chart suggests that historical demand previously emerged around that level. Earlier consolidation activity occurred before Bitcoin’s major rally higher. Markets often revisit such regions during extended corrections.
Sentiment Indicator Reflects Reduced Market Conviction
A separate chart compares Bitcoin’s price against a positioning metric. There were strong positive readings late in November 2024. They occurred while the sentiment was bullish throughout the market.
Green histogram readings prevailed throughout much of 2025. Bitcoin climbed to near cycle highs near $110,000. The participation in the markets was generally along the lines of the overall uptrend.
Conditions changed during late 2025 as momentum weakened. Price continued climbing while underlying participation slowed noticeably. Such divergences frequently appear near major turning points.
The sharp decline during early 2026 brought negative readings. Red histogram spikes reflected stronger selling pressure and deleveraging activity. Since then, sentiment has remained relatively muted.
Recent data reveals a further decline in market participation. Bitcoin is pushing back towards the $60k mark following a few recovery rallies.Bitcoin is bouncing back into the $60k range and making a comeback after a few recoveries. This is a period of cautious markets until better positive readings come through.
The combined charts present a consistent message regarding trend direction. Failed support levels, weaker participation, and resistance rejections remain central themes. For now, traders continue watching whether lower support zones can attract meaningful demand.