
- ARKM is testing a major support zone at $0.60-$0.70, which previously triggered strong buying interest and potential price rebounds.
- A breakout above $2.50-$2.60 resistance could drive bullish momentum, with mid-Bollinger Band ($1.61) as the first upside target.
- Stochastic RSI indicates oversold conditions, suggesting a potential reversal, but confirmation from volume and price action is needed.
The technical position of Arkham (ARKM) has reached a vital point while it strives to maintain positions above its confirmed support zone. The current market condition demonstrates high volatility giving traders two possible opportunities for bullish or bearish trading approaches.
Key Support and Resistance Levels
ARKM’s price is currently testing the support zone between $0.60 and $0.70, an area that has previously acted as an accumulation point. Historically, this level has provided strong buyer interest, leading to price rebounds. If this support holds, the next resistance to watch is at $2.50 – $2.60, a level where the price faced multiple rejections in the past. A successful break above this range could indicate strong upward momentum.
However, if the price fails to sustain above the support zone, further declines may be on the horizon. A breakdown could push ARKM toward lower levels, possibly around $0.50, where traders will reassess market sentiment.
Technical Indicators and Market Momentum
Bollinger Bands indicate increasing volatility, with the lower band expanding downward. The middle band (SMA-20) at $1.61 is another dynamic level to watch, as it could act as resistance if the price moves upward.
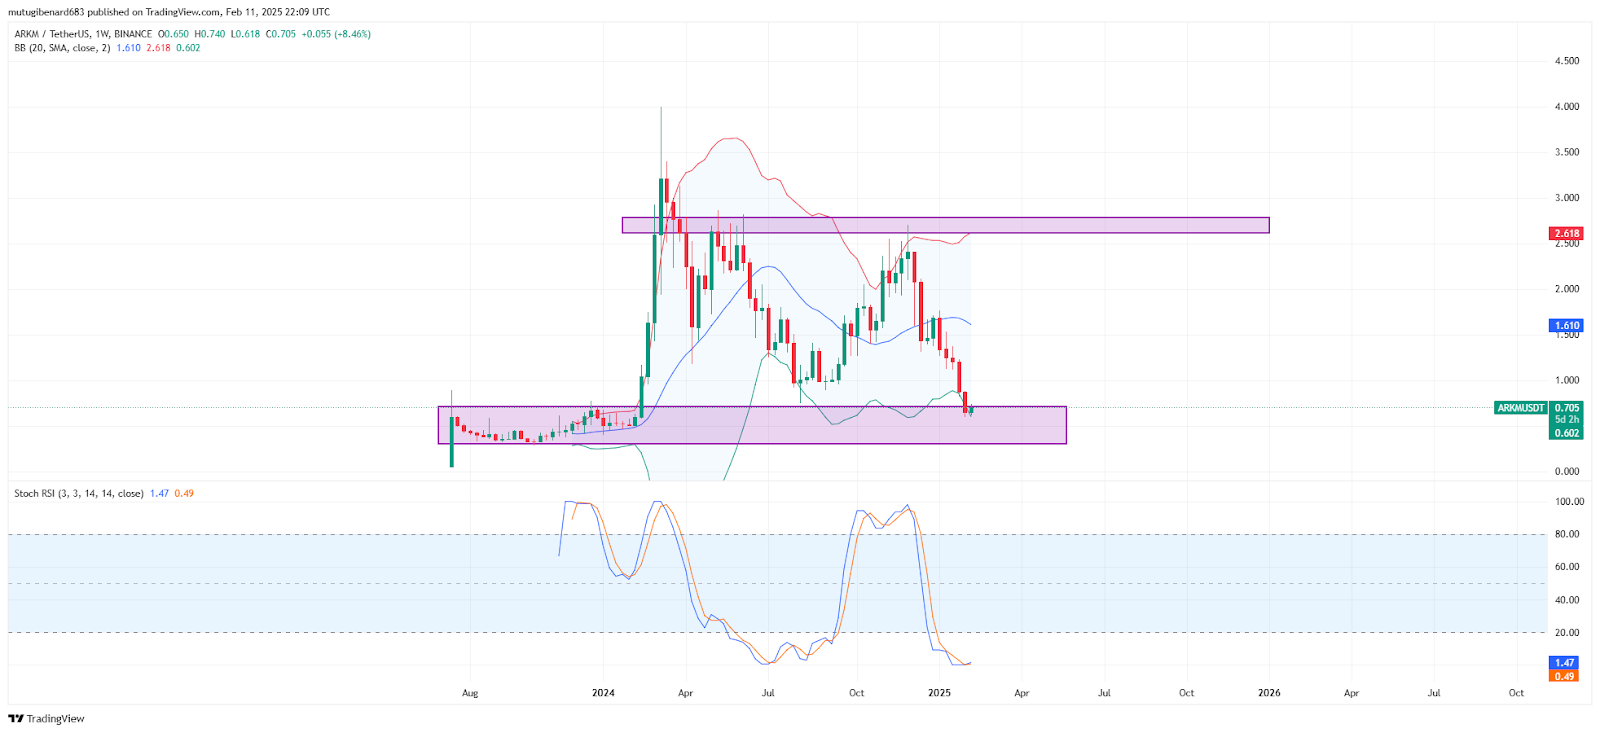
Meanwhile, the Stochastic RSI suggests ARKM is in an oversold condition. With readings of 1.41 and 0.47, this indicator signals that a potential price reversal could be near. A confirmed crossover in the oversold zone could strengthen the bullish case, but traders will need additional confirmation from price action and volume levels.
Market Scenarios and Potential Movements
For a bullish outlook, ARKM must maintain support above $0.60 – $0.70 while showing increased trading volume. A successful rebound from this range could propel the price toward the $1.61 mid-Bollinger Band level, with a further breakout targeting the $2.50 – $2.60 resistance zone.
The price falling beneath the support zone indicates the potential for a bearish market occurrence. Sustained selling pressure could push ARKM toward the $0.50 range or below while maintaining the present downward trend within Bollinger Bands.
At the time of writing, ARKM’s current share price reaches $0.7015 which signifies a 3.84% market increase within the past 24 hours and a 10.50% decrease during the previous week. Trader activity should focus on watching key levels because these form the basis for major trade confirmation.