
- ARB price finds important support around $0.42-$0.45, with market watchers following past trends in anticipation of a potential breakout.
- Technical indicators show weakening bearish momentum, with MACD and DMI suggesting possible bullish pressure if resistance levels are breached.
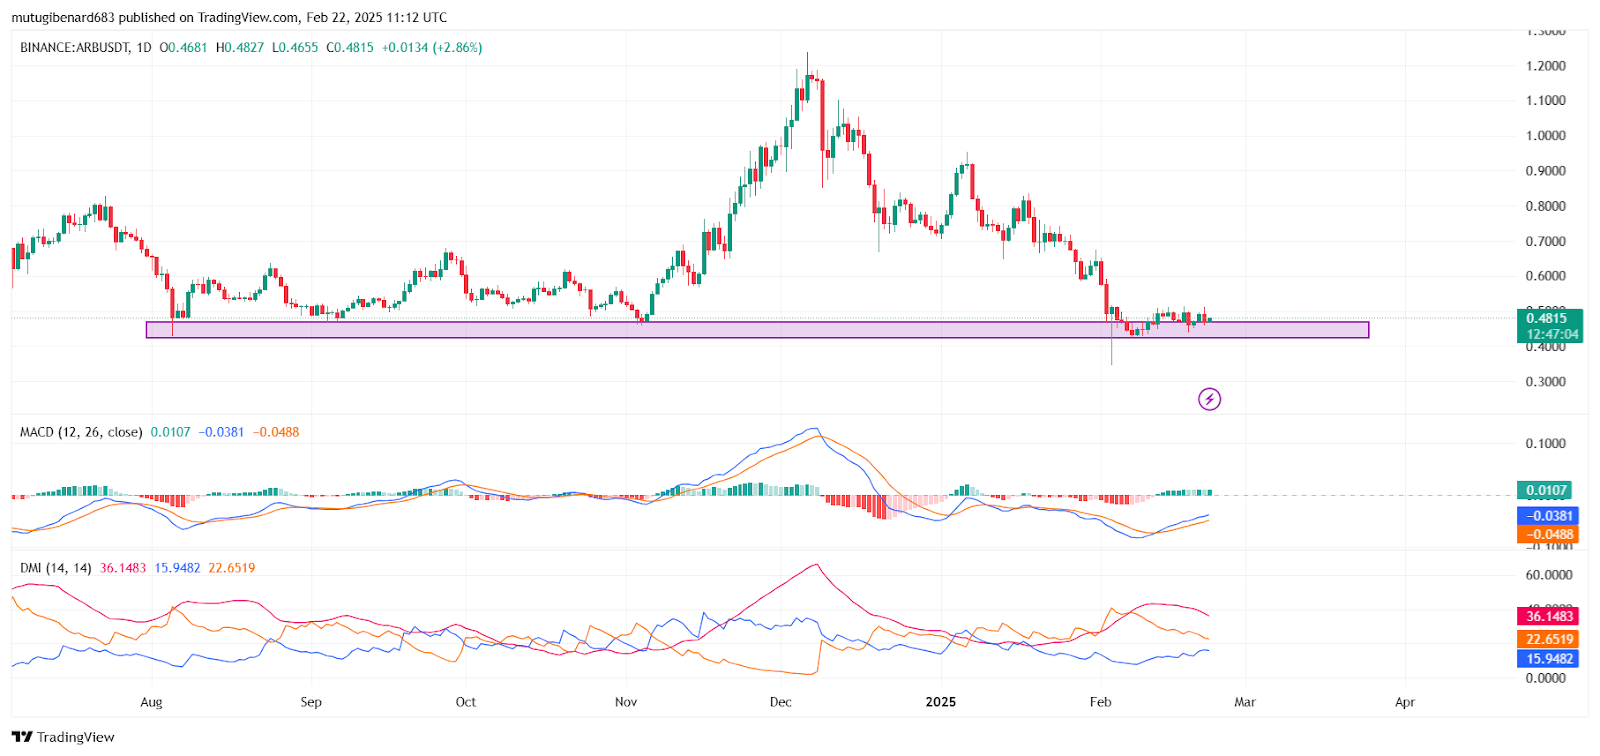
- A move above $0.68 may push ARB to $1.24, while the loss of support may cause the share to drop to $0.35.
The Arbitrum (ARB) price stabilized between $0.42 to $0.45 support zone and technical indicators signal that a price shift could happen soon. The price maintains a consistent upward trend in this specific area which acts as a critical point for investors deciding upon their next investment strategy.

Market Overview and Analyst Insights
Crypto analyst Lluciano_BTC has pointed out recently how the movement in the price in ARB is a carbon copy of a recent bull breakout. The setup and structure in the price are reported to portend a repeat performance in a corresponding movement in the past. It is a signal investors are expecting the old routine to repeat itself, and a repeat performance would see the market move upward again.
The analyst further noted that the structure of the market is taking a descending wedge form, the classical indication of a bull reversal. If ARB is following the same trajectory as before, a breakout possibility is looming and a large price appreciation in the coming weeks is a real possibility.
Support and Resistance Levels
Major Support Level ($0.40 – $0.50)
The blue rectangle that is highlighted is a high demand zone where price has previously shown significant reactions.
The price has lately probed this level again, hinting at a potential double-bottom structure, a signal suggesting a potential reversal in a trend.
Key Resistance Points ($0.68 and $1.24)
The $0.68 level (marked in blue) is a midpoint level of resistance; a breach above would confirm upward momentum.
The $1.24 level is a longer-term level previously a support level ahead of the major downtrend.
Trend Indicators and Market Sentiment
The MACD histogram is now in a positive turn, reflecting decreasing bearish pressure, and the MACD is trying a crossover. The crossover would signal increasing demand if confirmed. The Directional Movement Index (DMI) is also exhibiting a +DI line moving upward steadily, implying increasing purchasing pressure.
Yet, the ADX remains modest, and therefore trend power is still developing. Investors are monitoring these indicators in anticipation of whether ARB is going to sustain its current pricing movement or dip again. If the bull crossover is fulfilled, ARB could see increased purchasing pressure, confirming favorable market mood.
Possible Scenarios for ARB
Bullish Case:
If ARB crosses over $0.68, we would see a rally to $1.24 with potential upward movement on a journey to $1.50 – $1.80. It would signify high market optimism and greater purchasing power.
Bearish Case:
Failure to hold above the support level ($0.40 – $0.50) would see a fall down to $0.35 and lower. If selling pressure is ongoing, bear pressure could prevail, and market mood would suffer.
The price was $0.4808 at the time of writing with a market capitalization in the last 24h amounting to $270,580,116, decreasing in the last day by 4.69% and in the last seven days decreasing by 1.12%.