
- Sykodelic notes Ethereum’s 1-day RSI hits lows last seen during $1,350 bottom, signaling potential support and bottoming zone for traders.
- Negative daily funding during the uptrend has historically confirmed bottoms six of seven times, reinforcing Ethereum’s current support level, says Sykodelic.
- Market sentiment remains deeply bearish while Ethereum retests $3,850 breakout, aligning data and sentiment, highlighting a bottoming zone opportunity, according to Sykodelic.
Ethereum’s market shows potential bottoming signals, supported by both technical data and sentiment analysis. Observers note that identifying a “bottom zone” helps investors scale positions effectively over multiple days. Current metrics point to conditions rarely seen since previous major lows.

Technical Indicators Signal Potential Bottom
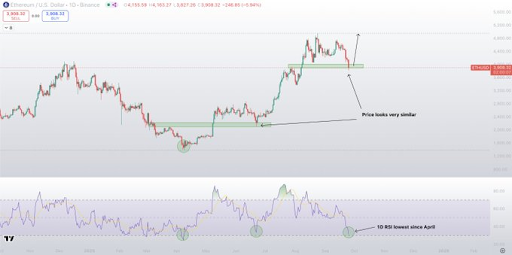
Ethereum’s 1-day Relative Strength Index (RSI) is reaching levels last observed during the $1,350 bottom amid the Tariff FUD. Low RSI values typically indicate oversold conditions, which can precede price stabilization. Analysts monitoring the market often use these metrics to define strategic entry points.
Data also shows persistent negative funding on the 1-day timeframe. Historical trends suggest that when negative daily funding appears during an uptrend, it has correctly predicted price support six out of seven times. Traders often rely on these recurring patterns to validate bottom zones.
Price has retested the one-week breakout area near $3,850. Retests of key breakout zones are considered important for confirming support levels. When price holds at these levels, it often signals consolidation before a potential upward move.
Sentiment Indicates Market Pessimism
Market sentiments are still very negative and reveal a sense of uncertainly amongst investors. Negative attitudes towards the short-term ethereum directions are demonstrated in large volumes by social activity and investor feedback. Traders frequently combine sentiment with technical data to improve timing strategies.
Sykodelic, a prominent market analyst, noted in a tweet that the combination of technical data and bearish sentiment strengthens the indication of a bottoming zone. When market participants express strong pessimism while indicators signal support, it creates a notable convergence for investors.
This confluence between sentiment and data forms a framework for traders to scale into positions gradually. Scaling reduces exposure to volatility while allowing entry near potential support levels. Analysts suggest observing both market psychology and data together for bottoming analysis.
Strategic Bottom Zone Considerations
Defining a bottom zone does not require pinpointing an exact price. Traders often focus on a range that allows for gradual position building over several days. This approach mitigates risk while capturing potential gains if prices stabilize or reverse.
Historical analysis of Ethereum shows similar patterns where bottom zones appeared with strong negative sentiment and low RSI readings. Recognizing these patterns can inform entry decisions in volatile markets.
Investors also monitor recurring technical signals, such as retests of breakout areas and daily funding trends. These measures provide tangible benchmarks to evaluate potential support levels. Observing such indicators helps maintain disciplined trading practices in uncertain market conditions.