

- XRP breaks a long-standing resistance from 2018, signaling strong bullish momentum and a potential shift in market sentiment.
- The EMA and MACD suggest continued strength, but a decreasing histogram hints at possible momentum slowdown and correction risks.
- Analysts eye $30.89 as a price target if XRP holds support, while failure could lead to a retracement toward lower levels like $1.50.
XRP has broken through a strong level of resistance, and its direction in the future is in contention.The asset has experienced a strong breakout, leading analysts to evaluate whether the bullish momentum can be sustained.
A recent tweet by crypto analyst Steph_iscrypto caused a stir about XRP’s future price direction. In a tweet, Steph_iscrypto sets an ambitious price target at $30, basing its argument on key technical breakouts and price actions in the past.
XRP Breaks Historic Resistance
XRP has broken through a long-standing 2018 level of resistance, a sign of strong bullish momentum. The level, having been tested several times in the past, could not resist. Breakout, therefore, signifies a change in market direction, with buyers driving price upward. There has ensued a sharp rise, and with it, speculations regarding its potential target for an upward move.
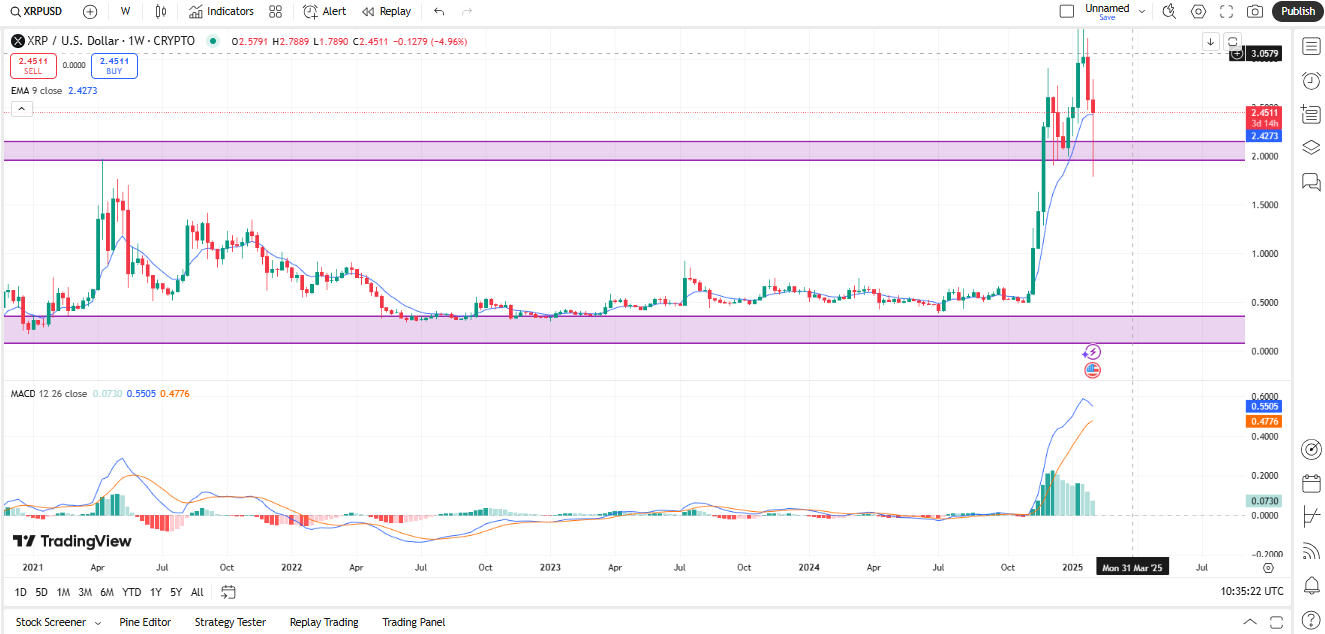
After breaking through the barrier, price temporarily eased off, re-testing its immediate past barrier as a new level of support. Re-testing is a significant technical confirmation that will validate whether XRP continues its gain momentum or slips into a state of consolidation.
Market Indicators and Price Action
Technical indicators, including the Exponential Moving Average (EMA) and Moving Average Convergence Divergence (MACD), expose direction in the marketplace. EMA (9) shows price still holding over its short-term trend, and bullish momentum is therefore intact. Break below, then, could mean a deeper retraction.
The MACD is in bullish position, with the MACD line still positioned over the signal line. Yet, the histogram is trending downwards, suggesting a deceleration in momentum. In case of a bearish crossover, XRP could face additional corrective price action before it will try to make a new rally attempt.
Potential Price Targets and Market Situations
Analysts suggest a target price of $30.89 based on price behavior in the past and measured move in a breakout. In case XRP continues at its current level and creates a base in the new zone of support, a move in an upward direction could follow. Break over $3.00 will confirm bullish expectation, and further price rise could follow.
If the new level of support fails, price can head towards lower support at $1.50. In a case of a failed breakout, XRP can head towards its range, and any future bullish momentum can be delayed.
Long-Term Outlook
XRP has seen a relentless bull run ever since 2020, with phases of build-up culminating in such a break outburst. Investor attention will closely follow key levels in determining whether such a move will be sustained. As long as price remains over its supporting level and experiences growing volumes, more upward momentum can be expected.