
- Chainlink may enter another corrective decline if wave B has topped, placing $11.90 support under renewed technical scrutiny.
- LINK’s corrective structure points toward the 10.30–11.30 support zone if selling pressure breaks the initial support level.
- Gate leads LINK open interest, Binance dominates volume, and BingX records the most futures trades across the exchanges shown.
Traders are watching for nearby support levels, Fibonacci resistance levels, and major exchanges activity in derivatives as Chainlink’s corrective structure has become weaker.
Wave B Completion Raises Downside Concerns
Chainlink is showing signs of a possible bearish turn on the four-hour chart. More Crypto Online suggested that wave (B) may have already topped. This interpretation raises the possibility of another downward leg within the corrective structure.
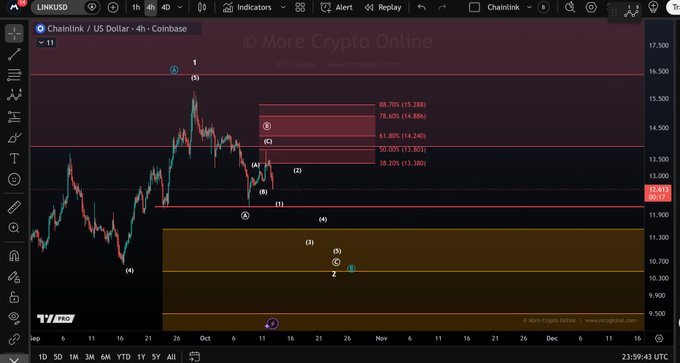
LINK recently retreated from a peak near $15, forming lower highs and lower lows. The latest chart places its price around $12.61, below the marked retracement region. This level places the support level at $11.90 on the radar screen.
In Elliott wave theory, wave B usually occurs as a short term recovery in a larger correction. If this wave is the end then a wave C may continue the downward trend. The proposed price, however, is still subject to further price action confirmation.
Fibonacci Levels Define Resistance and Support
There are some points on the chart at the Fibonacci Retracement levels above the current price. These include 38.2% near $13.80 and 50% around $14.03. The 61.8% mark is about $14.24, which is another guide in case of rebounds.
The level of 78.6% (about $14.89) and 88.7% (about $15.29) are higher levels of retracement. These are general resistance levels should LINK recover. However, their presence is not a guarantee that prices will head back to those areas.
On the downside, $11.90 represents the first important structural reference. The highlighted 10.30 – 11.30 support zone could be a key breakthrough if a decisive break were to occur. There are a few more marks in that range around $10.70 and $10.30.
Derivatives Activity Provides Market Context
Derivatives data indicates that various exchanges are connecting via open interest, trading volume and number of futures traded. Gate’s open interest in LINK is the highest at around $118.13 million. Binance is next with $111.84 million while Bybit holds $73.08 million.
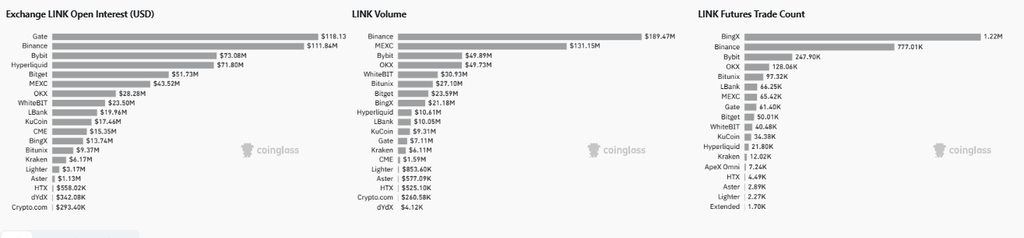
Binance is the top spot in reported volume with about $189.47 million, followed by MEXC at $131.15 million. In the meantime, BingX has seen approximately 1.22 million futures trades, surpassing Binance’s 777,010. The disparities demonstrate that the exposure of the best assets, trade volume, and transaction frequency differ by platform.
The derivatives figures are not sufficient on their own to confirm the bearish wave formation. Open interest is the number of outstanding contracts and volume is the number of contracts that have been traded during the reporting period. The number of trades reflects the frequency of deals, but not traders’ direction of trade.
Price action is therefore the main factor when determining the possible wave C scenario. If prices break below $11.90, then it will support the lower price support area. An above $13.80 recovery would put the immediate bearish interpretation under stress, and should be reconsidered.
At this time Chainlink is stuck in a dilemma of either a corrective extension or recovery. Major downside reference is the $11.90 level with the broader support zone of 10.30-11.30. The structure’s development is dependent on the build-out of or recovery from resistance by LINK breaks.