- PENGU gained about 90% from Crypto Patel’s entry zone and is now testing a descending higher-timeframe resistance line.
- Crypto Patel identifies $0.015, $0.028, $0.043 and $0.060 as key targets, with $0.0055 as setup invalidation.
- RSI remains above 50, but weakening MACD momentum puts $0.0100 support and $0.0110-$0.0112 resistance in focus.
PENGU is trading near $0.01117 after gaining about 90% from Crypto Patel’s entry zone. The token is testing a descending higher-timeframe resistance line, while Patel outlined targets at $0.015, $0.028, $0.043 and $0.060. Ali Charts also compared PENGU’s structure with PEPE’s early expansion, correction, consolidation and later rally.
PENGU Tests Major Higher-Timeframe Resistance
Crypto Patel said PENGU has reached the descending higher-timeframe resistance line. He said a clean break, acceptance and retest could confirm the trendline breakout. PENGU previously found support near $0.0055, while Patel identified $0.0090 as the confirmed breakout level.
The token remains about 77% below its $0.047-$0.048 macro high. Patel listed $0.015, $0.028, $0.043 and $0.060 as major upside targets. He said $0.060 would represent roughly 10X from his entry zone.
However, Patel said sustained losses below the $0.0055 support would invalidate the setup. He also said he wants confirmation rather than chasing a price candle.
Ali Charts Compares PENGU With PEPE
Ali Charts said PENGU’s current structure resembles PEPE’s early expansion pattern. The comparison covers explosive attention, a correction from highs, months of consolidation and a later liquidity-driven rally.
According to Ali Charts, PENGU may now be entering the part of the cycle where PEPE began its largest expansion. He identified PEPE as Ethereum’s meme coin example and PENGU as a possible Solana counterpart.
Meanwhile, the 4-hour chart shows PENGU recovering from a September low near $0.0068-$0.0070. Price formed higher highs and higher lows before breaking $0.0090 and reaching the $0.0110 area.
PENGU Momentum Cools Near $0.0112
PENGU currently trades around $0.009974 on the chart, with the latest candle reaching $0.010085. Trading volume is at 29.73 million PENGU, while rejection appeared around $0.0110-$0.0112. The RSI reads 63.44 against its 71.50 moving average.
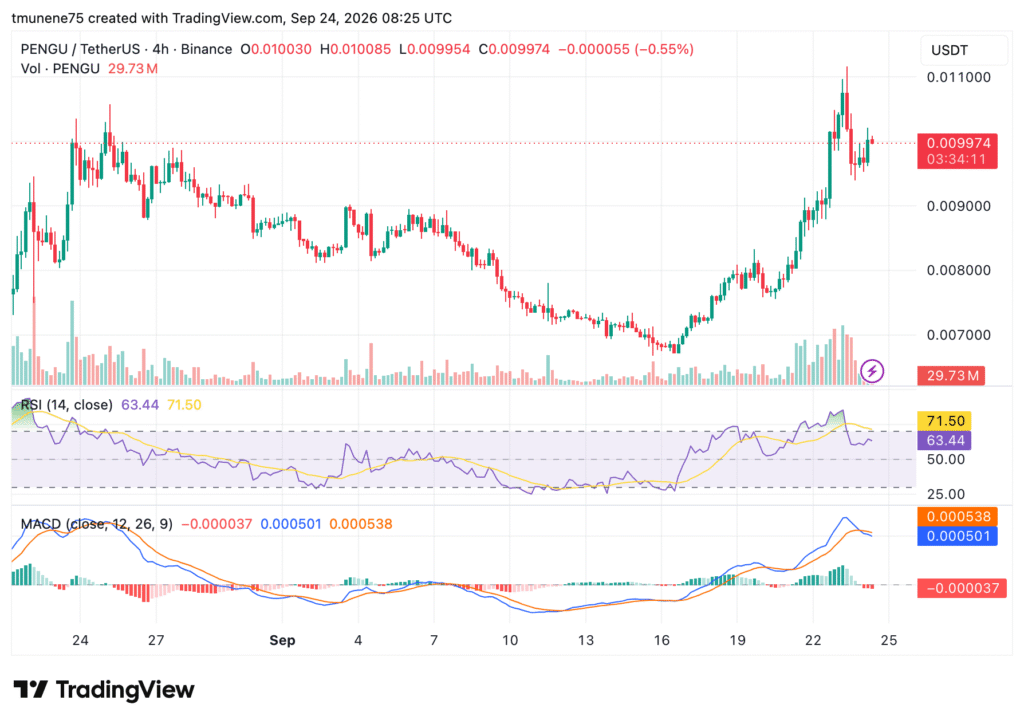
Although RSI remains above 50, the decline from above 70 shows weaker momentum. The MACD line is at 0.000501, below the 0.000538 signal line. Its histogram reads -0.000037, indicating bearish momentum has started emerging.
For price levels, $0.0100 remains the key psychological area. Holding it could allow another test of $0.0110-$0.0112, while losing it exposes $0.0090 and $0.0080.