
- SUI’s weekly Parabolic SAR flipped bullish after an 83% decline, with the indicator’s dots moving below price.
- SUI remains above its 50-day and 200-day averages, while $0.87-$0.90 provides key support.
- Analysts are watching $1.02-$1.05 resistance, with $1.16 and $1.40 as higher levels if the breakout continues.
SUI has flashed a weekly Parabolic SAR reversal after an 83% bear market decline, according to Ali Charts. The indicator’s dots have moved below price, while SUI trades near $0.967 after reaching about $1.05. Analysts Investor Jordan and Michael van de Poppe are also watching support, resistance and potential tests toward $1.16 and $1.40.
Weekly SAR Flips After Deep SUI Decline
Ali Charts said the weekly Parabolic SAR now points below SUI’s price. He described the shift as a move from a downtrend toward a new uptrend. The indicator tracks trend direction and potential reversals.
Its dots moving below price represent bullish momentum under the indicator’s framework. Meanwhile, SUI spent June and July between roughly $0.65 and $0.80. The decline followed a fall from about $1.40 in mid-May.
The structure changed in August when SUI moved above $0.90 with higher trading volume. However, price later entered another consolidation phase before September’s advance.
Analysts Track SUI Support And Resistance
Investor Jordan said buyers appeared around the one-week support after SUI’s latest drop. However, he noted that SUI had lost its 9/21-day moving averages. Jordan said those averages could provide resistance.
He also said he expects SUI to reach above $2 soon. Van de Poppe said SUI remains in consolidation and could experience a short correction. However, he identified $1.16 and $1.40 as levels that could be tested.
Those levels follow SUI’s recent move through $0.80, $0.90 and $1.00. Price briefly reached approximately $1.05 before pulling back.
SUI Holds Above Key Moving Averages
The 50-day moving average is near $0.869, while the 200-day average stands around $0.791. SUI remains above both averages after the recent advance. Notably, the 50-day average has turned upward.
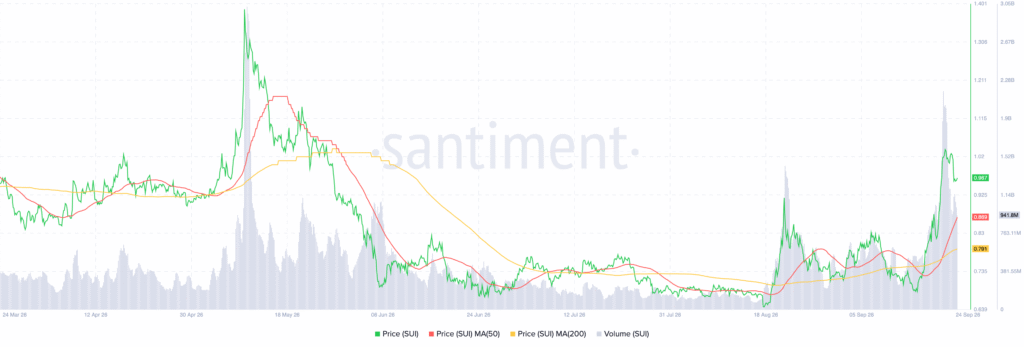
The $0.87-$0.90 area now provides a key support reference on the chart. On the upside, $1.00 remains the immediate psychological level. The $1.02-$1.05 range represents the latest resistance area.
A break above $1.05 would place higher levels on the chart. However, rejection near $1.00-$1.05 could expose $0.90. The chart also shows $0.87 and $0.79 as deeper support levels. Meanwhile, Ali Charts identified the weekly SAR reversal after SUI’s 83% decline.