
- XRP remains near $1.36 as buyers defend support, while $1.39 resistance controls the next potential recovery attempt.
- Neutral funding shows derivatives positioning has cooled, leaving leverage balanced after the recent breakout and prolonged retracement.
- The current retest remains unresolved, with $1.35 support and descending resistance defining the immediate technical range.
XRP remains caught between support and descending resistance as traders monitor whether the recent retest completes before week’s end.
Retest Develops Beneath Descending Resistance
The recent structure follows a powerful breakout from prolonged weakness. Price has risen from approximately $0.90 – $1.00 towards $1.60. It eventually found its way into a controlled retracement at around $1.65-$1.70.
CW stated that the retest should conclude before the week closes. The accompanying chart shows price compressing beneath a descending short-term trendline. That structure keeps the immediate focus on a possible breakout or renewed rejection.
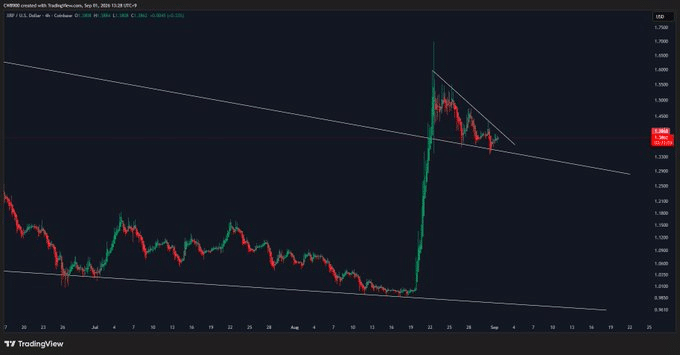
The broader formation had previously contained price beneath declining resistance. Lower highs dominated the structure across several months. The breakout temporarily disrupted that sequence and created a stronger short-term advance.
The subsequent pullback has remained measured compared with the breakout itself. Price continues trading above the area where the advance began. This keeps the retest relevant while sellers remain active near descending resistance.
$1.36 Support Becomes the Immediate Battleground
As of writing price stands at $1.36, keeping the market near immediate support. The $1.36-$1.37 region has attracted repeated buying and selling activity. Price movement around this zone should determine the next short-term direction.
If the price stays above $1.37, there is an opportunity for further extension to $1.38-$1.39. Clearing $1.39 would improve the current short-term structure. The next resistance area would then sit closer to $1.50.
Failure to defend $1.35 would weaken the current consolidation pattern. Sellers could then target lower sections of the recent breakout structure. Such a movement would place renewed pressure on buyers defending the broader recovery.
The chart also shows substantial recent trading activity around these levels. It is estimated that 24-hour volume was around $2.03 billion. The market cap is around $85.59 billion and the circulating supply of 62.74 billion tokens.
Funding Rate Shows Leverage Has Reset
The OI-weighted funding chart presents a different picture from the price structure. Funding has generally remained close to neutral across the latest period. Positive and negative readings have appeared without sustained extreme positioning.
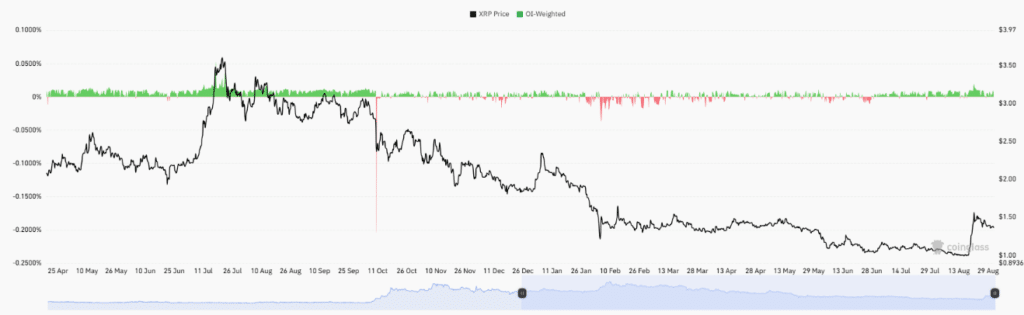
During the earlier rally, funding remained mostly positive as price accelerated higher. That combination reflected stronger demand for leveraged long exposure. The subsequent reversal produced a sharp negative funding spike before conditions normalized.
The later decline toward lower levels occurred alongside relatively subdued funding. Short-lived negative readings appeared during several downward moves. However, those readings did not remain extreme for extended periods.
Current funding conditions therefore show a market with relatively balanced derivatives positioning. A renewed breakout could bring stronger long positioning and rising funding. Conversely, a breakdown below support could increase short exposure across the market.
The immediate technical range remains clearly defined by $1.35 and $1.39. Holding support would preserve the current retest structure. Breaking either boundary should provide clearer evidence about the next directional move.