
- Ethereum builds a large inverse head and shoulders pattern with a projected target near $7,600.
- ETH rebounded from the $2,860 region after a rapid liquidity sweep during early December trading.
- Whale positioning shifts after a $6 million long order appears during the market’s recovery phase.
Ethereum trades in a recovering weekly structure after a volatile start to December. Market data shows price stability returning as a broad reversal pattern continues to mature, reflecting shifting momentum across higher time frames.
Large Weekly Pattern Shows Expanding Structure
Ethereum forms a potential inverse head and shoulders pattern that spans multiple market cycles. According to a chart shared by Bitcoinsensus, the structure shows a clear left shoulder forming in mid-2024 after a sharp pullback. This early pivot defines the initial touch of the ascending neckline that sets the boundary for future price interaction.
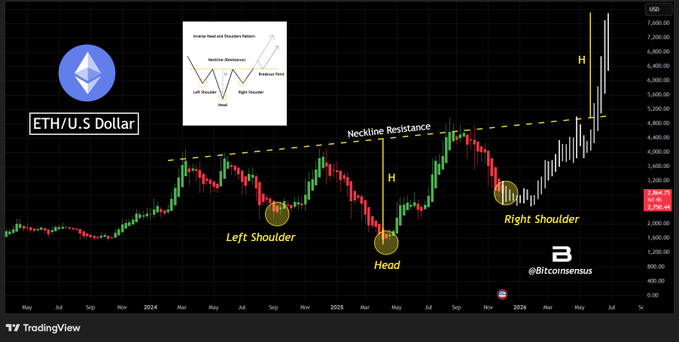
The pattern’s head appears during early 2025 when ETH prints the deepest trough in the formation. Price recovers strongly from this point and rallies toward the neckline with a clean upward push. This reaction adds symmetry to the structure and shows that buyers absorbed liquidity at lower levels.
The right shoulder develops later in 2025 and forms a higher low relative to the head. Its shape remains stable, with gradual upward movement that signals waning seller pressure. Once ETH breaks above the neckline, the weekly chart displays a set of impulsive candles that confirm pattern activation. The measured target sits near $7,600 based on the height of the head projected from the breakout zone.
Recent Price Action Shows Controlled Recovery
Ethereum as of writing trades at $2,996.12 after a sharp rebound from a multi-day pullback. The performance of the week is +2.34% with the market cap being placed at $361.61 billion after an increase of 8.71%. The volume of trading fell by $21.95-$26.76 billion indicating that the recovery was buyer-led and not well-participated.

ETH opened the period near $2,919 with stable movement through late November. A steady climb carried the price above $3,000, where it formed a narrow consolidation band. This range acted as a temporary balance zone before conditions shifted at the start of December.
Price broke below the consolidation area and moved into the $2,860–$2,880 region. The move accelerated during early December 2, forming the sharpest downturn of the week. The decline cleared excess leverage and created an oversold pocket. Volume stayed moderate, showing the move came largely from liquidations rather than strong selling conviction.
Rebound Strength Supported by Market Activity
ETH recovered quickly after the downturn and printed a V-shaped reversal from the $2,860 zone. Price pushed back into the mid-$2,900s within hours, reclaiming most of the drawdown. The speed of the reaction indicates active demand near discounted levels.
A post shared by Peter notes that a whale wallet opened a $6 million long position shortly after closing a profitable short. This shift in positioning drew attention because large traders often enter during elevated volatility. While not directional confirmation, the move reflects interest at lower price zones.
As the rebound extends, ETH trades close to reclaiming $3,000, positioning itself back near the upper boundary of the recent chart. The broader weekly structure continues to align with the long-forming reversal pattern, setting the market around key psychological levels as trading progresses.