
- Cardano dropped to $0.8518 on the 4 hour chart, with support at $0.85–$0.852 and resistance near $0.89–$0.90.
- Analyst Ali’s TD Sequential reading now suggests a potential buy setup despite recent short term bearish momentum.
- Long term Fibonacci analysis compares current structure to 2020, with resistance at $1.15 and extension targets above $3.
Cardano has had renewed strength after fresh technical readings showed opposing short term and long term signals. Analyst Ali stated that the TD Sequential indicator, which previously identified a market top, now suggests that conditions are changing toward a potential buy setup.

This comes as ADA’s four-hour chart shows a persistent downtrend, while broader cycle analysis places the asset in an early stage bullish phase compared with its past performance.
Persistent Downward Pressure
Cardano has posted a steady sideways movement. A sequence of lower highs and lower lows developed across multiple four hour candles. Price action moved from the $0.93 to $0.90 range, then entered a brief consolidation marked by small bodied candles.
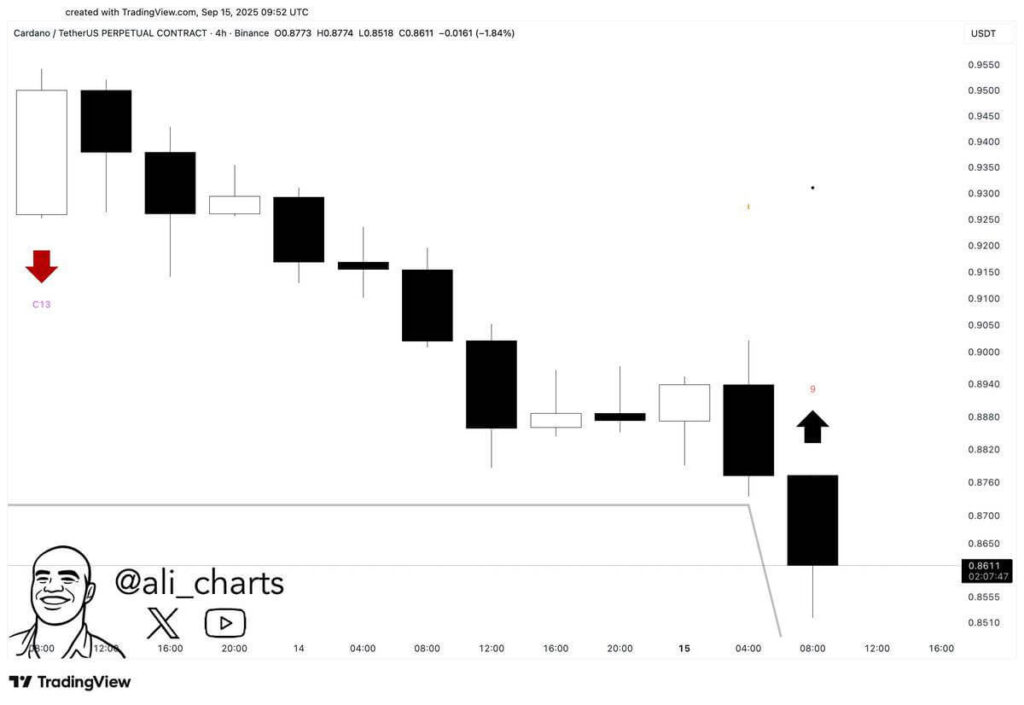
The breakdown that followed produced a strong bearish candle, which closed at $0.8611 after reaching a low of $0.8518. Notably, a grey falling line, likely a moving average, angled downward throughout the move, supporting the negative momentum.
The chart also contained annotations showing a prior sell signal and a failed bounce attempt. Analysts are watching immediate support between $0.85 and $0.852, the zone where the latest wick reached. Resistance remains at $0.89 to $0.90, where a minor relief attempt stalled.
Breakdown or Rebound?
The short term setup indicates that momentum remains bearish. A decisive close below the $0.85 level would confirm trend continuation and potentially open lower targets. However, a rapid recovery above $0.90, backed by sustained volume, would be required to neutralize pressure and shift bias toward stability.
Volume activity and higher-timeframe structure are viewed as important confirmation tools for whichever direction emerges. This cautious approach underlines the importance of these levels, as failure or recovery here may define Cardano’s next move.
Early Bullish Setup
Alongside the intraday outlook, analyst Ali presented a broader cycle analysis using Fibonacci retracement and extension levels. The study compared ADA’s 2018 to 2021 cycle with its current 2023 to 2025 structure.
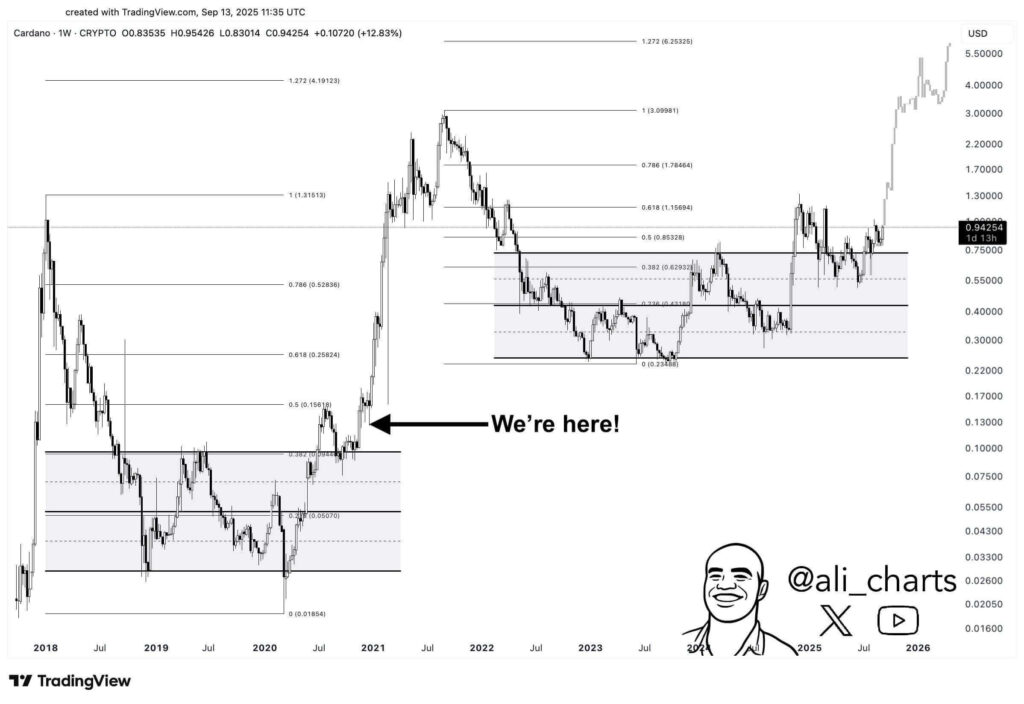
A key annotation marked “We’re here!” placed the asset at a stage similar to mid 2020, just before its explosive rally. Previously, Cardano accumulated between $0.01854 and $0.15618 before breaking above the 0.5 retracement at $0.15618.
That breakout led to a surge to $3.09981 and extended further toward $4.19123 at the 1.272 extension. Currently, ADA has consolidated between $0.23 and $0.63 before advancing above the 0.5 retracement at $0.85328.
At press time, ADA was trading at $0.8719, a 1.23% daily gain. Upcoming resistance levels include the 0.618 retracement at $1.15694 and the 0.786 level at $1.78464. Analysts note that a close above $1.15 would confirm upward continuation, while losing the $0.85 zone could invite a retest of $0.63. This structural symmetry places focus on ADA’s ability to maintain momentum within this emerging phase.