
- Merlijn The Trader sees Ethereum repeating its 2018–2021 setup, predicting a possible surge beyond $10,000 by late 2025.
- EtherNasyonal notes Ethereum’s 2024 breakout above $3,800, calling the zone a key support for sustaining further gains.
- Analysts stress $1,800–$2,000 and $3,800–$4,000 as the key levels that could determine Ethereum’s next market move.
Ethereum latest market structure has drawn strong comparisons to past cycles, with analysts pointing to historical setups that once fueled exponential gains. According to market analyst Merlijn The Trader, Ethereum has now completed a pattern identical to the one observed between 2018 and 2021.
During that period, Ethereum consolidated for years before breaking out from $200 to more than $4,000 in under twelve months. He noted that a similar configuration is active again, though with larger institutional participation this time.
2021 Breakout Model Reappears in 2025
From 2018 to 2020, Ethereum endured a lengthy accumulation phase near $100–$200 after its 2018 decline. A temporary recovery around mid-2018, described as a “Dead Cat Bounce,” faded before prices stabilized at those lower levels.
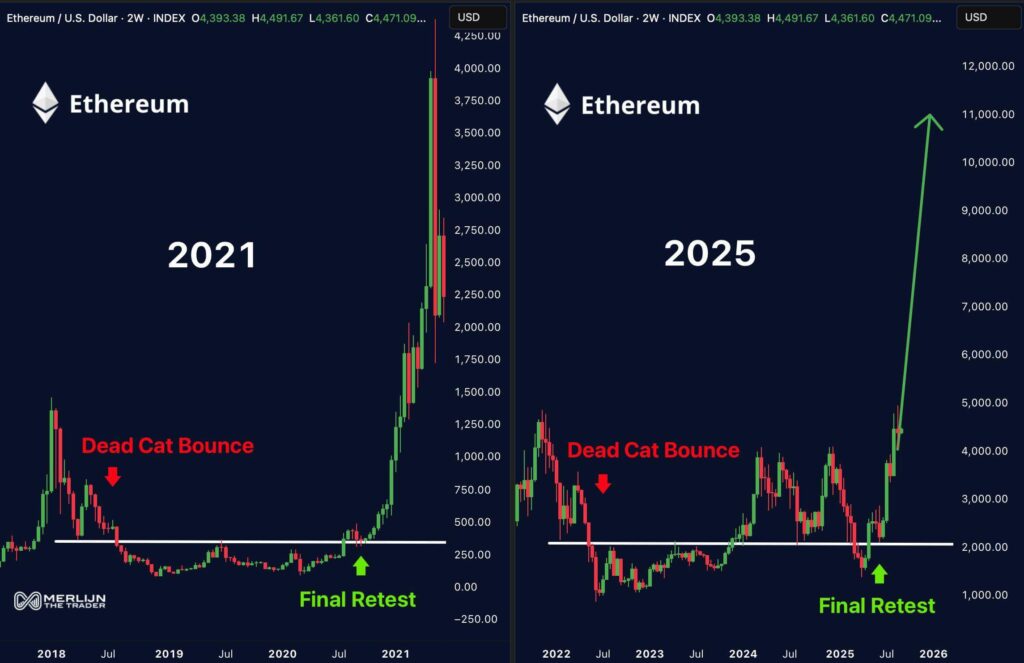
By late 2020, a “Final Retest” of this support zone set the stage for a sharp surge. Within the following year, the cryptocurrency accelerated into a parabolic rally, topping $4,000 and marking a defining bull phase.
Analyst Merlijn highlighted that Ethereum’s recent behavior since 2022 shows a near-identical path. After the 2022–2023 downturn, Ethereum posted a recovery near $2,000 before falling back toward $1,500–$2,000 support.
The current market structure is now described as another “Final Retest.” If sustained, projections point to levels above $10,000 by late 2025 or early 2026, continuing the cycle observed in the previous rally.

$3,800 Resistance Breakout
Another perspective from analyst EtherNasyonal on X compared Ethereum’s current setup to its 2017 breakout. Back then, Ethereum consolidated below $16 throughout 2016, failing multiple times to breach resistance.
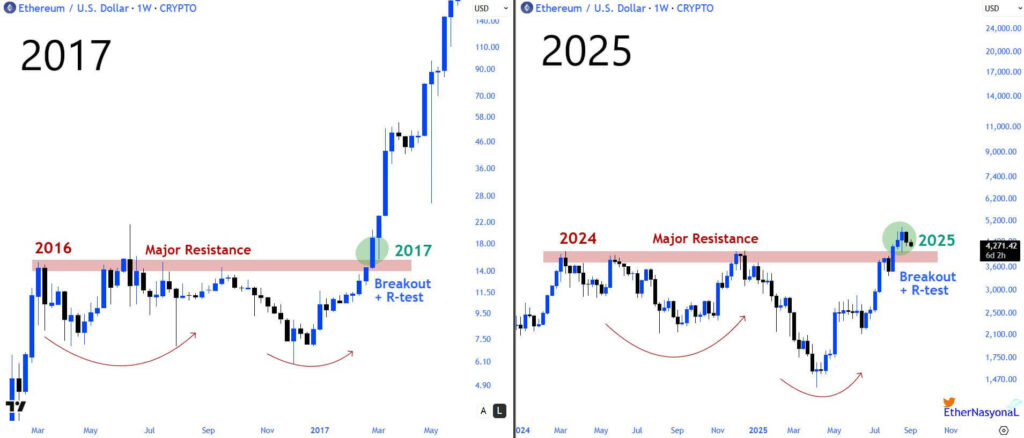
The eventual breakout in early 2017, confirmed by a swift retest of support, ignited a rally from $15 to over $140. EtherNasyonal noted Ethereum’s price action through 2024 displayed a similar pattern under the $3,500–$3,800 resistance zone.
After repeated rejections, Ethereum managed to clear the level in 2025, climbing toward $4,200–$4,300. His chart emphasized that the $3,800–$4,000 region now acts as the critical support base to validate this breakout.
Key Levels and Ethereum Movement
The two analysts outlined different but historically consistent scenarios pointing to major upward potential. Merlijn identified $1,800–$2,000 as the essential level for sustaining the 2021-style setup.
EtherNasyonal stressed that $3,800–$4,000 must hold as support to extend the 2017 style breakout. Together, these technical outlooks define the zones that could determine Ethereum direction in late 2025.