
- Ethereum’s price compresses within a multi-year triangle, identical to Bitcoin’s 2020 setup that triggered a historic bull run.
- Technical momentum indicators like RSI and MACD resemble pre-breakout patterns seen in Bitcoin before its massive 2020 price explosion.
- Fractal symmetry suggests Ethereum could follow Bitcoin’s breakout roadmap, with July marking the potential start of a major rally.
Ethereum (ETH) appears to be tracing the exact path Bitcoin (BTC) followed before its massive 2020 bull run. A striking chart shared by Titan of Crypto shows ETH mirroring BTC’s historic breakout structure, pointing to a possible major price surge.

Symmetrical Triangle Forms as Momentum Builds
It is the comparison of two symmetrical triangle shapes: that of the BTC in 2017-2020 and that of ETH in 2021-2025. In the example of Bitcoin, the price action twisted back in the triangle over the years and broke out later in July 2020. Such a step triggered a strong bull run and sent BTC to new heights.
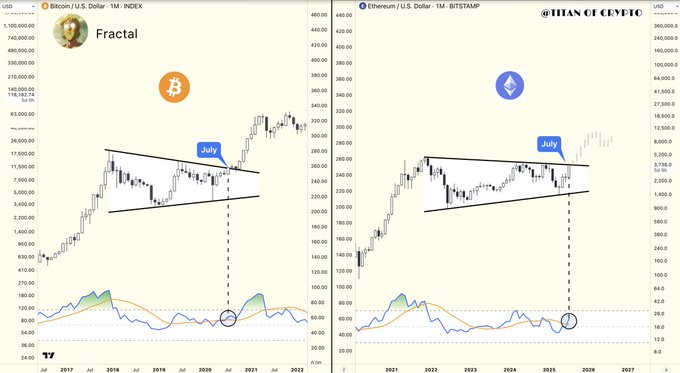
Now, Ethereum is replicating that same setup. The price is compressing near the apex of a multi-year triangle, with momentum indicators curling upward—just as they did with Bitcoin. The RSI/MACD-style momentum indicator, as seen on the chart, is beginning to flash similar bullish signals. According to Titan of Crypto, “Breakout loading.”
The timing also aligns with historical patterns. July again stands out as the likely breakout month. The chart’s visual symmetry suggests that ETH is following the same calm-before-the-storm behavior that preceded BTC’s parabolic move.
Fractal Symmetry Suggests Ethereum’s Next Leg Up
Titan of Crypto describes the setup as “fractal symmetry,” pointing out that ETH is walking the same path Bitcoin did four years ago. The structure is mature, and indicators suggest momentum is building. As Ethereum coils at the apex, market participants are closely watching for confirmation of a breakout.
As of writing, Ethereum trades at $3,813.82, showing a 1.06% gain in the last 24 hours and a 2.59% increase over the week. With volume surpassing $22.6 billion, the market is active as ETH approaches this critical juncture.
If history repeats itself, the breakout from this triangle could mark the start of Ethereum’s next major uptrend. Eyes are now fixed on Ethereum, as the chart suggests the stage is set.