
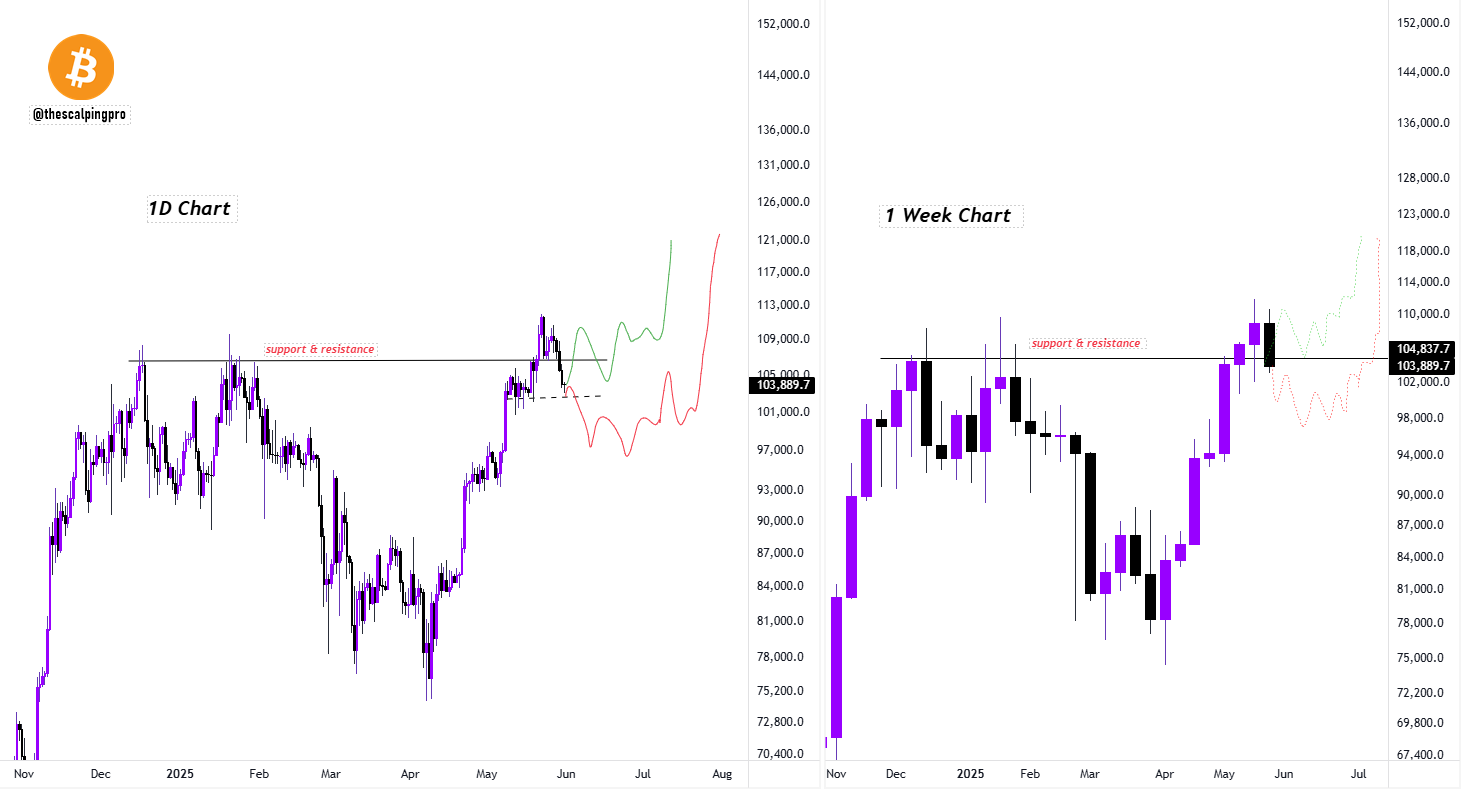
- Bitcoin has fallen below its previous all-time high on the daily chart, signaling a possible short-term correction.
- On the weekly chart, Bitcoin remains above the prior ATH, suggesting the breakdown might be a retest or wick.
- A weekly close below key support could form an inverse Head and Shoulders pattern, indicating a deeper pullback ahead.
The daily chart reveals that Bitcoin has now descended beneath its previous highest price level which has triggered discussions about the weakening of the ongoing bull run. The market observers direct their focus toward the upcoming weekly market closing because it will establish short-term market developments.
Daily Breakdown Raises Concerns Among Traders
According to market analyst, Mags, Bitcoin has dropped beneath its former all-time high on the daily timeframe. This move is being seen by many as a potential early signal of a deeper correction. Additionally, BTC is currently facing rejection at the same level it previously broke, adding to bearish sentiment in the short term.
Traders observing this behavior are questioning if the bull cycle might be in jeopardy. The inability to reclaim the horizontal level after the breakdown indicates that market momentum may have shifted. However, not all timeframes are aligning with the bearish outlook just yet.
Weekly Chart Still Shows Bullish Potential
Despite the breakdown on the daily chart, Bitcoin is still holding above the previous all-time high on the weekly chart. Mags noted that if BTC manages to maintain its current position on the weekly close, this move could be interpreted as a retest or a wick rather than a full breakdown.
This potential bounce could mean the correction is shallow, serving as a setup for future upside. Market participants are closely monitoring the weekly candle. If the weekly closes below this critical support and resistance line, then BTC could enter a deeper correction phase in the coming sessions.

Pattern Watch: Inverse Head and Shoulders Possible
Mags also shared that a deeper pullback may result in the formation of an inverse Head and Shoulders pattern, which has often preceded bullish moves in past market cycles. This structure would require more downside before establishing the right shoulder and potentially reversing upwards.
The coming days remain crucial. Until the weekly close is confirmed, traders remain cautious but alert to both bullish and bearish scenarios. Bitcoin’s reaction at this stage will likely guide short-term price direction and determine whether the current move is just a shakeout or the start of a broader retracement.