
- Bitcoin maintains bullish momentum above $102K as it approaches the key $104.9K resistance with a breakout signaling potential ATH.
- USDT Dominance falls to 4.68% within a long-term downtrend, indicating sustained capital flow into Bitcoin and altcoins.
- Market sentiment strengthens as stablecoin exits fuel BTC’s climb past $100K and ETH’s rise beyond $2.5K amid tightening price action.
Bitcoin continues to show bullish momentum as price action respects an ascending triangle formation on the 1-hour timeframe. As of May 15, 2025, BTC trades at $102,891.26, slightly down by 0.24%. However, the trend remains intact. The price recently bounced off a strong ascending trendline, reaffirming its role as reliable support. This line has supported several swing lows since the pattern began forming.
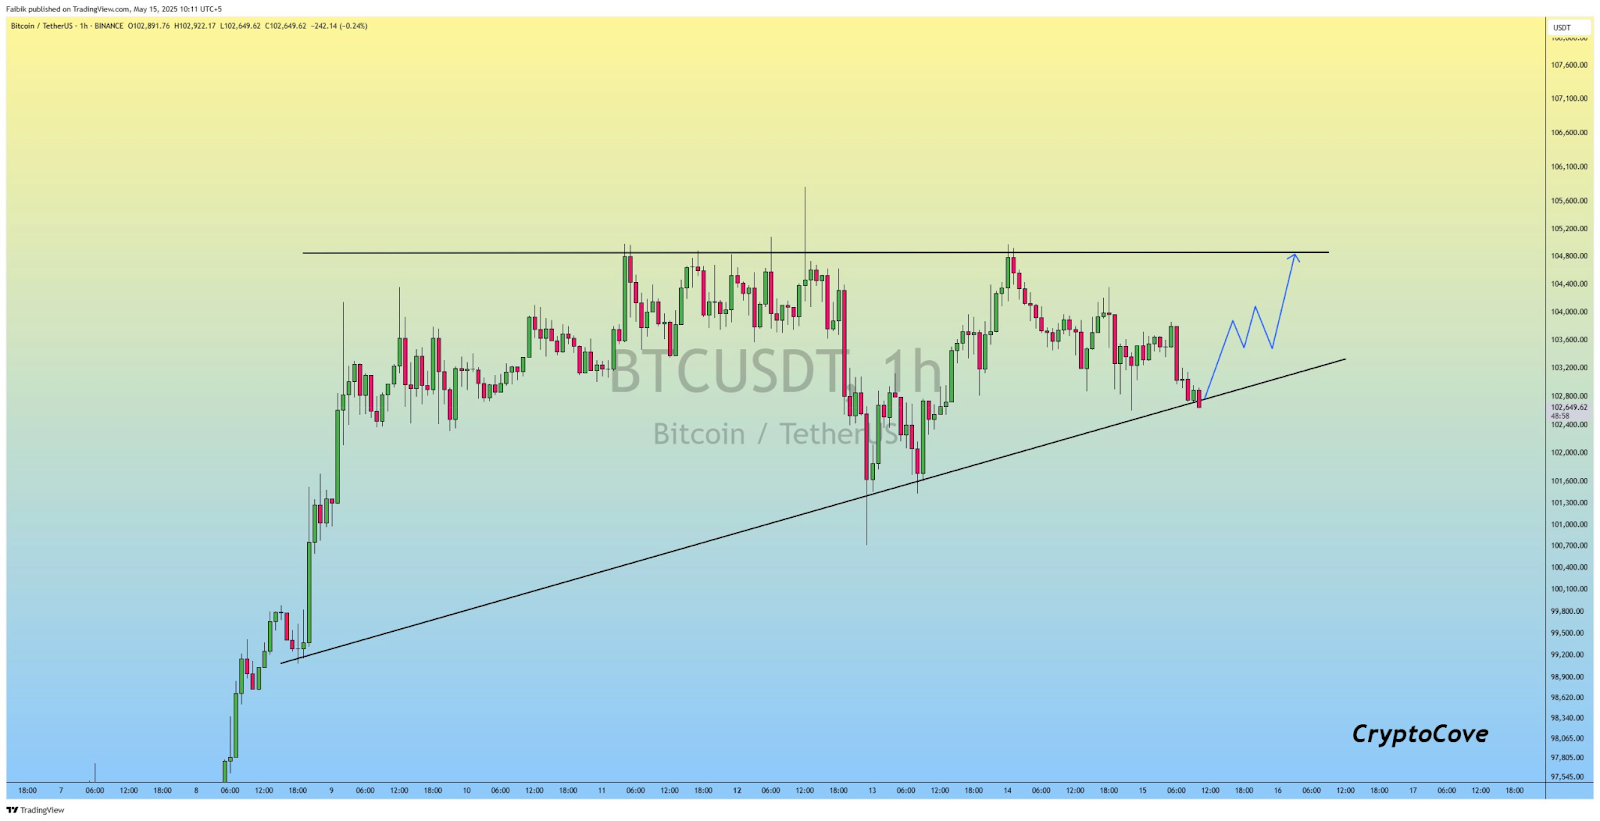
Source: Captain Faibik
The critical resistance level stands at $104,900. Multiple failed attempts to break this ceiling highlight strong selling pressure. However, the latest bounce from $102,400 suggests bulls are still in control. Consequently, a breakout above $104.9K could open the door for a new all-time high. Besides, consolidation phases between resistance and support hint at growing bullish pressure.
USDT Dominance Continues Long-Term Downtrend
Meanwhile, USDT Dominance tells a parallel story. The metric sits at 4.68%, reflecting a 2.33% increase despite the macro downtrend. The Data, tracked from 2022 to 2025, shows a prominent descending channel. This formation stretches from 9.49% at the top to 1.91% at the bottom. Moving averages ranging from 4.96% to 5.29% now sit above the current price.
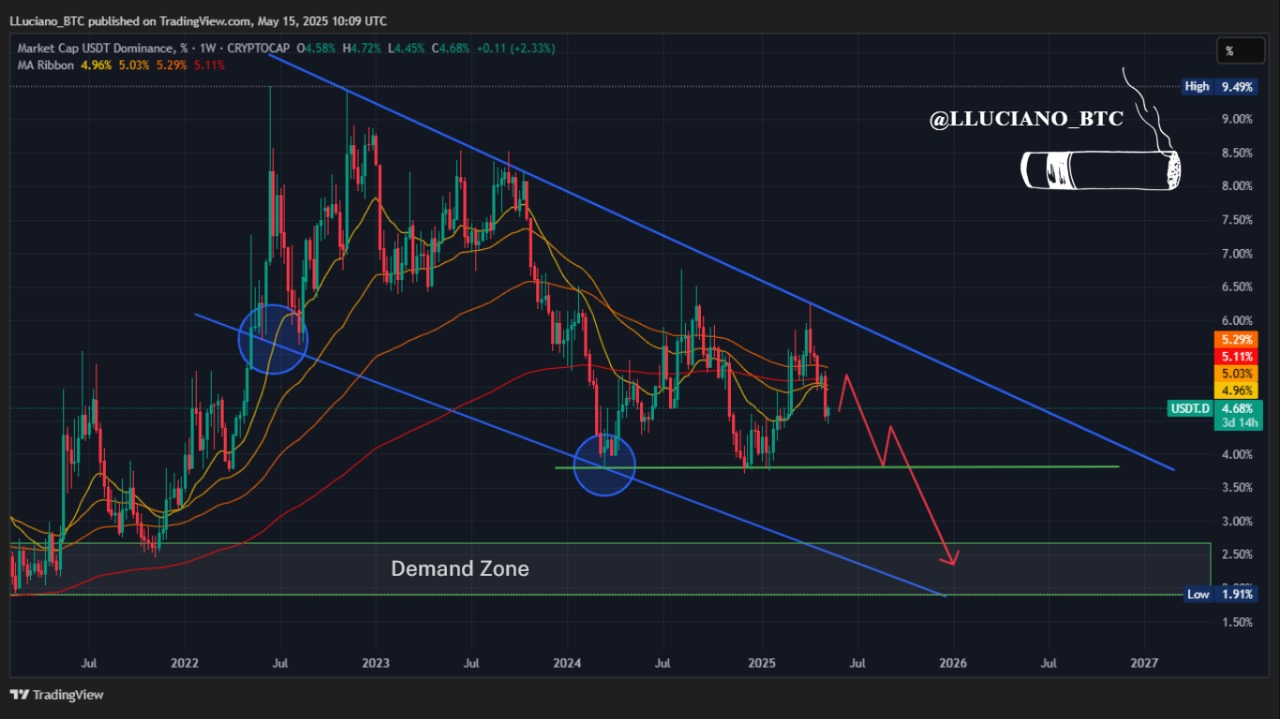
Source: Lucky

Hence, this confirms persistent bearish momentum in USDT Dominance. A red projection arrow suggests continued decline toward the 2% range by late 2025 or early 2026. Additionally, blue circles highlight earlier bounce zones at crucial channel supports. These reversals validate the long-term demand zone near the channel’s lower boundary.
Capital Flowing Back Into Crypto
Moreover, the steady decline in USDT Dominance signals renewed capital interest in Bitcoin and altcoins. Traders typically convert stablecoins into volatile assets during bullish phases. Consequently, Bitcoin’s surge past $100K and Ethereum’s jump beyond $2,500 support this trend.
Furthermore, lower USDT dominance often coincides with rising total crypto market cap. Current CRYPTOCAP indicators show broad gains, reinforcing this sentiment shift. Smaller candlesticks and tighter ranges suggest decreasing volatility before a potential breakout.