

- Bitcoin appears to transition toward bearish market conditions according to the MVRV Ratio together with the Inter-Exchange Flow Pulse signals.
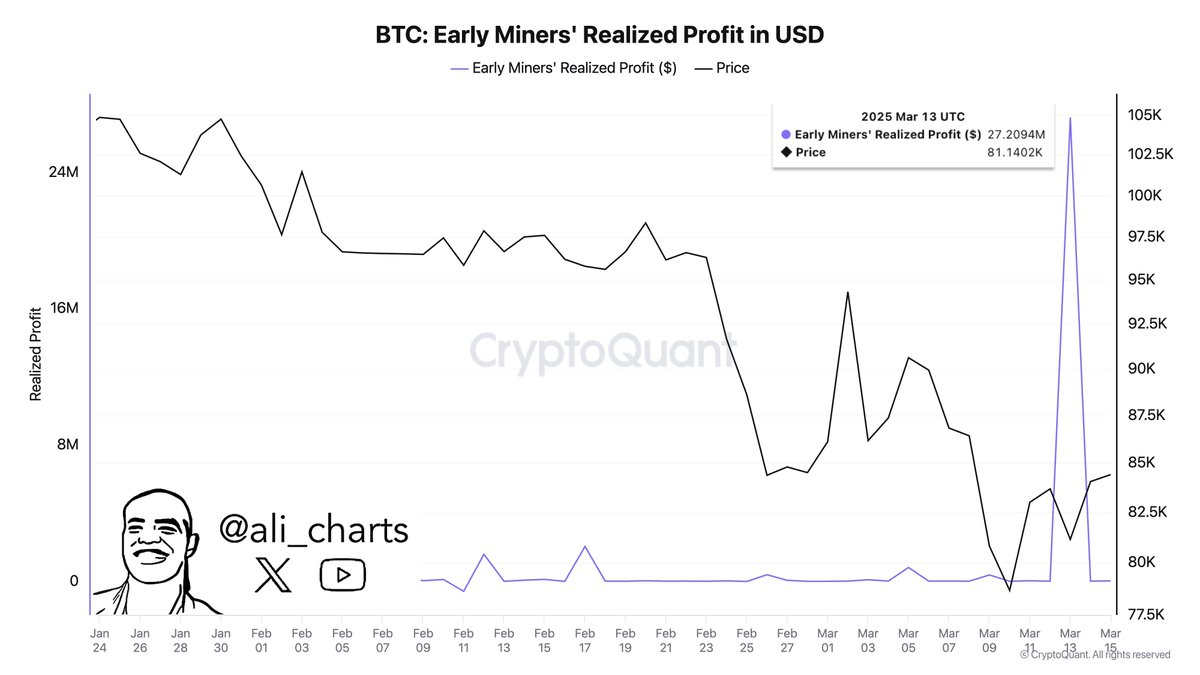
- Large investors together with miners have extracted $287 million worth of profits despite capital inflows reducing from $135 billion to $4 billion.
- The primary Bitcoin support zones exist between $66,000 and $69,000 and the market data indicates it may fall to approximately $46,000 based on previous patterns.
Bitcoin appears to be entering a bear market as multiple market signals indicate a corrective phase. Recent data shows shifts in investor behavior and trading flows that suggest caution among market participants. The trend may influence key support levels in the near term.
Bear Market Signs in Bitcoin
Several market indicators now point toward a potential Bitcoin bear market. The Inter-Exchange Flow Pulse, tracking spot and derivative flows, signals a corrective phase. Trading metrics show a clear shift in market momentum. The MVRV Ratio now registers negative, suggesting reduced positive momentum for Bitcoin.
The Market Cycle indicator reveals early stages of a bear trend. Price action has slowed, and technical markers have shifted into negative territory. The current market environment reflects broader caution. Such signals encourage market watchers to monitor price levels closely.
Investor Activity and Profit Taking
Large investors have become cautious, actively selling into the market. Bitcoin miners recently realized over $27 million in profits. These profits represent a notable exit from positions. In parallel, Bitcoin whales extracted over $260 million in profits. The sizable withdrawals point to significant profit-taking activity.
Capital inflows experienced a steep decline from $135 billion in December to $4 billion at present. This drop in capital inflows adds pressure on Bitcoin’s price. Investor sentiment appears to be shifting towards a defensive stance. The decrease in inflows further aligns with the observed market corrections.
Key Support Levels and Recovery Trends
Numerous technical indicators designate the $66,000–$69,000 price area as a vital area that provides support. The purchase of Bitcoin at $69,000 by 750,000 investors stands data from investment analytics. Other metrics identify support around $69,354 and $66,000. This data suggests traders see value within this price range.
Historical price behavior shows that Bitcoin often recovers after breaching key moving averages. Bitcoin has trended towards the 200-week SMA, now at approximately $46,000, when falling below the 50-week SMA. Market trends indicate that rising global liquidity could spur recovery. Historical patterns suggest mid-April may see renewed price action.
Reclaiming support at $93,700 could open a path toward a higher target near $111,000. Technical analysis shows that overcoming this barrier may drive further upward movement. These observations offer a framework for monitoring future market performance. Traders and analysts remain attentive to these levels, assessing potential price recovery and stabilization.
Overall, Bitcoin currently exhibits multiple technical signals that require careful observation. The market presents clear support zones that may offer resilience amid ongoing corrections. Investors now await further developments as the market responds to these shifts.