
- Mags anticipates a major rally for SUI, with technical indicators suggesting a possible price breakout from current support levels.
- Bollinger Bands show SUI rebounding from lower support, while Stochastic RSI indicates oversold conditions that could trigger recovery.
- If SUI holds above $2.00 and breaks $3.61 resistance, analysts see potential upside targets reaching $4.50 to $5.00.
SUI draws strong market interest as institutional news and technical signals suggest a possible reversal. The token trades at $2.2390 amid active institutional filings, bullish tweets, and notable technical readings.

Institutional Developments
Sui Network announced that CanaryFunds has filed for the first-ever SUI ETF. This filing aims to bring SUI closer to public markets and grant investors direct exposure. The filing arrives as institutional interest grows, backed by over $70B in DEX volume and 67M+ accounts.
Such developments could increase liquidity and expand market participation. The ETF move offers a new avenue for conservative investors to engage with SUI. This institutional progress strengthens SUI’s market narrative and may foster additional investor confidence.
Market Sentiment
Crypto analyst Mags recently tweeted, “$SUI double digits soon,” suggesting a significant upward move ahead. This tweet reflects market optimism and complements the recent ETF filing news. It indicates that analysts expect a strong price rally soon.
The message from Mags resonates with market participants seeking bullish signals. The tweet adds a layer of positive sentiment among investors and encourages a closer watch on price movements. It serves as a prompt for analysts to monitor potential short-term rebounds.
Technical Indicators Analysis
Bollinger Bands provide critical support and resistance levels for SUI. The 20-period SMA, acting as the middle band, is set at $3.6190. The upper band sits at $5.2967, and the lower band at $1.9412, where the current price finds support. The token bounces off the lower band, indicating temporary stabilization around $1.94 to $2.00.
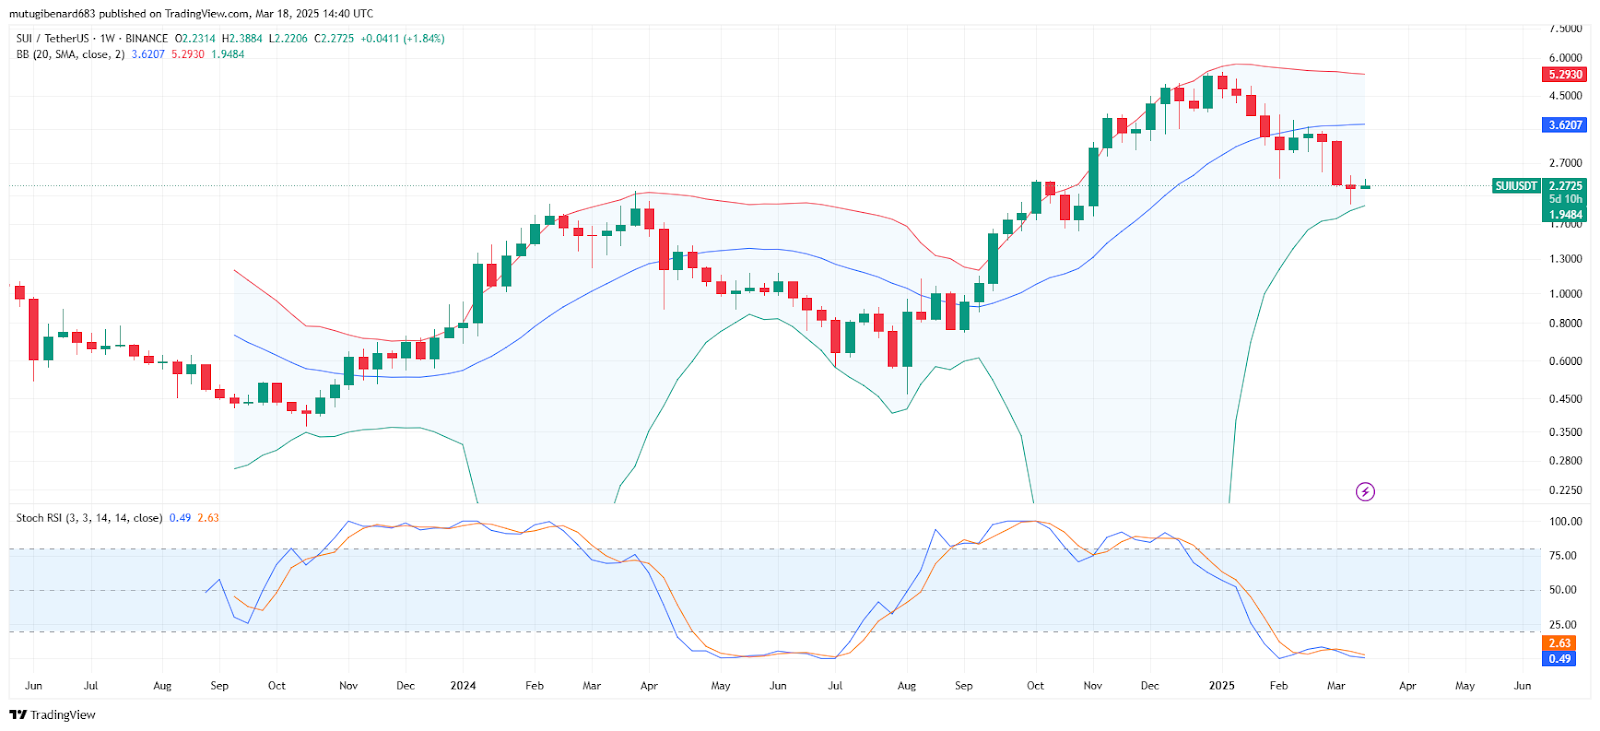
Stochastic RSI readings reveal that SUI is deeply oversold, with %K at 0.09 and %D at 2.50. This oversold condition suggests a potential bounce or reversal if a confirmed upward crossover occurs. Traders are closely watching these indicators for signals that may confirm a short-term rally.
SUI’s correction from previous highs above $6 has set the stage for a critical test of support levels. With institutional backing, bullish tweets, and technical signs hinting at recovery, market participants remain alert to decisive moves in the coming sessions.