
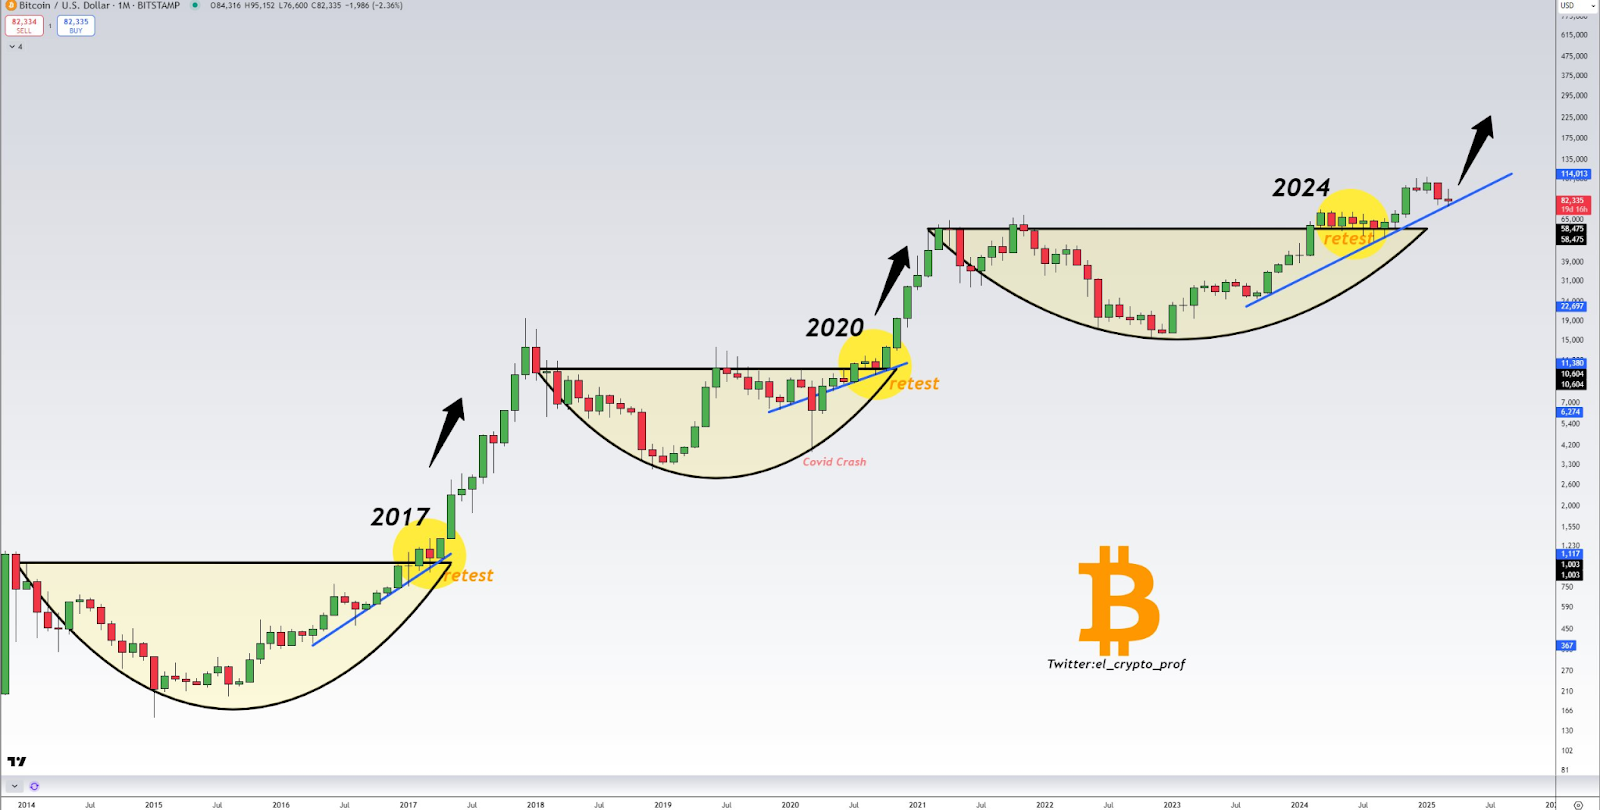
- Bitcoin demonstrates a market pattern in its current cycle that replicates the patterns from 2017 and 2020 by forming a “Cup and Handle” pattern before previous major price increases.
- Strong bullish trends commonly start after support levels have hit their retest points, according to analysts.
- Bitcoin’s return to low RSI Bollinger Band levels suggests a potential move higher, similar to previous cycles.
Historical price patterns in Bitcoin continue to repeat with market features that are similar to those from 2017 and 2020. The “Cup and Handle” pattern emerges once again as Bitcoin involves a crucial moment during its breakout reevaluation. Previous market cycles signal that Bitcoin could experience a positive price surge in the upcoming months, according to expert analysts.
Repeating Market Cycles and Historical Trends
Bitcoin has shown a consistent cyclical pattern, where price corrections are followed by long accumulation phases and subsequent breakouts. The 2017 cycle saw a deep market downturn before a gradual recovery led to a major uptrend. A similar pattern emerged in 2020, with the Covid Crash briefly disrupting the market before Bitcoin reached new all-time highs.
A recently shared chart by el_crypto_prof, crypto trader and analyst, on X emphasizes that the same structure is forming in 2025. A breakout has already occurred, and Bitcoin is now testing previous resistance as support. The presence of a rising trendline suggests that the long-term uptrend remains intact. If this structure holds, history could repeat itself with another surge toward higher price levels.
Technical Indicators and Market Sentiment
Key technical levels suggest Bitcoin’s price is at a crucial juncture. The black resistance line seen in previous cycles has now turned into support, a bullish confirmation if it holds. The yellow-highlighted “retest” areas in the chart represent moments when Bitcoin has historically confirmed support before experiencing major rallies.
Crypto analyst CryptoCon provided additional insights, pointing out that Bitcoin has returned to critically low RSI Bollinger Band% levels, a zone where it does not remain for long. Historical comparisons show that Bitcoin’s current structure closely mirrors March 2017, a period that preceded a prolonged bull run. According to the analysis, the cycle top may still be several months away, reinforcing the idea that Bitcoin could experience further price appreciation.

Future Scenarios and Market Outlook
Given the prevailing market structure, two potential outcomes emerge. New all-time highs for Bitcoin are likely to occur when the cryptocurrency maintains positions above its blue trendline. The past cycle patterns indicate Bitcoin will maintain its sustainable growth path as predicted by this trajectory.
On the other hand, if Bitcoin fails to maintain support at its retest zone, a temporary price decline could follow. This scenario would delay but not necessarily invalidate the current cycle. Market participants remain divided, with some anticipating further corrections, while others see strong fundamental support for continued growth.
The historical record of Bitcoin’s adherence to structured price cycles strengthens the case for an upcoming bullish trend. The market analysts state that the upcoming price movement will resemble past years based on the current trendline pattern.